
Abercrombie & Fitch Overview
In this article I present a dividend safety analysis of Abercrombie & Fitch Co (ANF). The company is a retailer of casual clothing, accessories, and personal care products for men, women, and children. The main interest for some investors is the high forward yield of ~4.7%. The company does not qualify as a dividend growth stock since it last raised the dividend in 2013 and it has been constant since then. The high yield is attractive, but investors should be wary since earnings do not always cover the dividend. Furthermore, earnings are volatile year-to-year. This places the dividend at risk for a freeze or even worse, a cut. On the positive side, the company generates decent annual cash flow and has a net cash position on the balance sheet. But still, Abercrombie & Fitch is dependent on generally declining mall traffic and fashion trends. This adds an element of risk for investing in this stock for income.
Before I present the dividend safety analysis, let’s first discuss Abercrombie & Fitch’s businesses. The company has two business units: Hollister and Abercrombie & Fitch. But it has four brands: Hollister, Gilly Hicks by Hollister, Abercrombie & Fitch, and abercrombie kids. Hollister focuses on teens, whereas Abercrombie & Fitch is more of a weekend casual brand. Hollister is the larger brand with about 60% of sales and Abercrombie & Fitch generates about 40% of sales. The company operated ~881 (at end of Q3 2019) stores in the U.S. (677 stores), Canada (18 stores), Europe (126 stores), Asia (50 stores), and the Middle East. (10 stores). The company also sells merchandise through its websites, third party wholesale, and licensing arrangements. Roughly two-third of revenue is from the U.S. and the remainder from international sales.
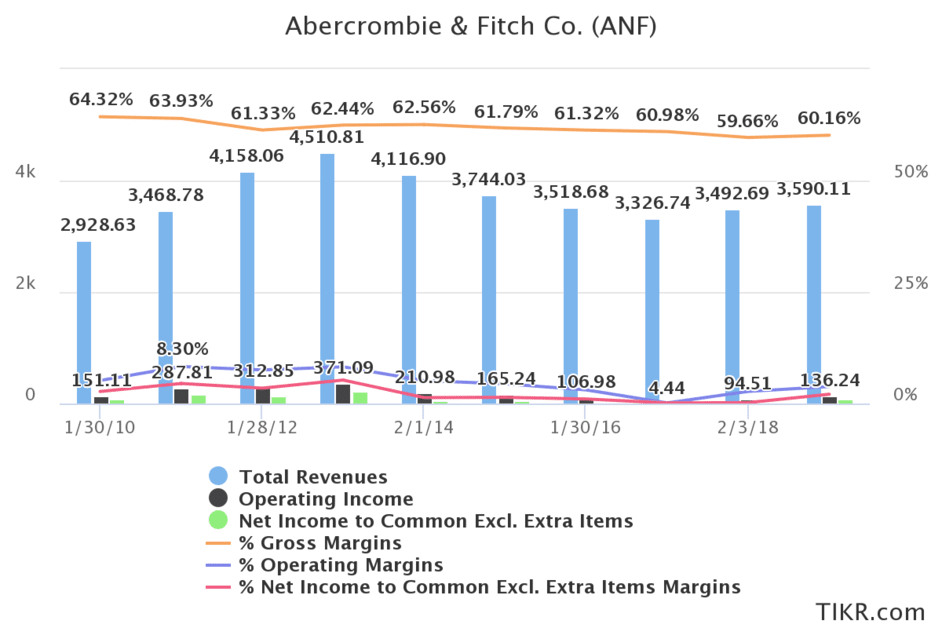
Abercrombie & Fitch’s top line declined from fiscal 2013 to fiscal 2017. Since then, it has been growing albeit very slowly. In general, Hollister sales tend to grow at a faster rate than that of Abercrombie & Fitch. But both brands have faced headwinds due to intense competition from other retailers and e-commerce. Companywide organic sales growth increased at low-single digit rate in 2017 and 2018. But 2019 looks to be a slower year with flat organic sales growth relative to 2018. Gross margins, operating margins, and net profit margins have also exhibited long-term decline as seen in the chart below based on data from TIKR.com*. Despite an uptick the past couple of years, margins are lower than several years ago. There is seemingly no easy path for margin improvement with current competition in retail.
The company guided down after Q3 FY2019 for the top line and gross margins. The market has punished Abercrombie & Fitch’s stock price, which is down nearly (50%) from the 52-week high and trading now at ~$16.82. The stock has not yet attained its all-time peak set in early-2008 or a more recent high set in mid-2011.
Abercrombie & Fitch is making efforts to reduce its square footage, close underperforming stores, update store formats, improve marketing and customer experience, and increase operational efficiencies. That said, this will take some time to accomplish. Furthermore, it is essentially the same strategy being pursued by many traditional bricks-and-mortars retailers. The competition is not standing still whether it is online or in bricks-and-mortar. This will make it more difficult for the company to gain traction in the U.S. and overseas.
Abercrombie & Fitch Dividend Safety
Let’s now examine the dividend safety of Abercrombie & Fitch. From the perspective of earnings, the dividend is not covered at the moment. Consensus FY 2019 EPS is $0.67, and the annual dividend is $0.80 per share. This means that Abercrombie & Fitch will need to use cash on hand or add debt to pay the dividend. This presents higher risk to the dividend when combined with the flat in top line.
The dividend is not covered by free cash flow either in some quarters. At end of Q3 FY2019, operating cash flow was $2.22M and capital expenditures were $60.15M giving free cash flow of ($57.93M). The dividend required $12.57M. Note that Abercrombie & Fitch experiences seasonality in sales and cash flow. The fourth quarter generates the highest sales and cash flow. Hence, on an annual basis, dividend coverage is better. In fiscal 2018, operating cash flow was $352.9M and capital expenditures were ($152.4M) giving free cash flow of $200.5M. The dividend required $53.7M giving a dividend-to-FCF ratio of 26.7% This is a good value and meets my criteria of 70%.
Debt is a bright spot right now since the company has a net cash position. The company has long-term debt of only $241.3M at end of Q3 FY 2019. This is offset by $410.8M in cash and cash equivalents on hand. The company seemingly does very well in managing cash flow and retaining a positive net cash balance. Interest coverage is OK at about 5X, but I would like to see this higher. Debt doesn’t currently place the dividend at risk.
Final Thoughts On Abercrombie & Fitch
Abercrombie & Fitch’s yield is attractive. At approximately 4.7% it far exceeds that of the broader market. It is also higher than that of many conventional income stocks. But Abercrombie & Fitch faces intense competition from bricks-and-mortar stores and e-commerce channels. In addition, tariffs and trade friction are also providing headwinds. The company is not clearly a turnaround story when compared to some other retailers. Still the top and bottom lines have shown choppiness in the past. But with that said, the company generates positive cash flow on annual basis and the balance sheet is healthy. However, due to the volatility of the stock price this stock is best suited for investors with high risk tolerance. It is clearly not a conservative income stock.
Related Articles on Dividend Power
Here are my recommendations:
Affiliates
- Simply Investing Report & Analysis Platform or the Course can teach you how to invest in stocks. Try it free for 14 days.
- Free Dividend Kings Spreadsheet from Sure Dividend, complete with Buy/Hold/Sell recommendations, dividend histories, and much more. It is an excellent resource for DIY dividend growth investors and retirees.
- Stock Rover is the leading investment research platform with all the fundamental metrics, screens, and analysis tools you need. Try it free for 14 days.
Receive a free e-book, “Become a Better Investor: 5 Fundamental Metrics to Know!” Join thousands of other readers !
*This post contains affiliate links meaning that I earn a commission for any purchases that you make at the Affiliates website through these links. This will not incur additional costs for you. Please read my disclosure for more information.
Prakash Kolli is the founder of the Dividend Power site. He is a self-taught investor, analyst, and writer on dividend growth stocks and financial independence. His writings can be found on Seeking Alpha, InvestorPlace, Business Insider, Nasdaq, TalkMarkets, ValueWalk, The Money Show, Forbes, Yahoo Finance, and leading financial sites. In addition, he is part of the Portfolio Insight and Sure Dividend teams. He was recently in the top 1.0% and 100 (73 out of over 13,450) financial bloggers, as tracked by TipRanks (an independent analyst tracking site) for his articles on Seeking Alpha.