
How Do People Get Rich?
How Do People Get Rich? This is the second article in a row I am writing on getting or being rich. Last week I wrote about Is It Hard to Get Rich? Today, I am discussing how do people get rich since the topic is interesting. The noteworthy thing is that the “how” has changed with time comparing today in 2021 to forty years ago in 1982. Why are we looking at 1982? Well, that was the first year that Forbes published its list of 400 richest people in America. So, there is a reference point and authoritative list of people that were rich at that time. There are many more lists now and there is data to help answer the question are you rich. But, comparing the list in 1982 and 2021 is instructive and does provide insights.

How Did People Get Rich 1982?
Turn back the clock 40 years and in 1982, there were fewer ways to reliably get rich. I would argue that the stock market was not one of the ways for most small investors. Commissions were high and you pretty much needed a broker to buy stocks. Opening up an online account and placing commission free trades for free was simply not an option since it did not yet exist. U.S. Treasuries yielded over 13% and interest rates on CDs and savings accounts were relatively high so many small investors focused there. There were really no opportunities for being an online entrepreneur, and in general doing a start-up was likely rough going due to limited access for capital and resources. So, in 1982 there were less choices to get rich at least from today’s perspective.
But how did people get rich in 1982? Examining the list of richest people in the U.S. in 1982 is enlightening. Inheritance was significant source of wealth for many people. The data shows that in 1982 about 59% of the 400 richest Americans inherited their wealth. Essentially, they were lucky enough to be born rich. In fact, in 1982 the Forbes list of 400 richest people in America included many heirs from the DuPont, Rockefeller, Ford, Mellon, Hunt, Hearst, and other wealthy families. These families had old money. Many of these families made their fortunes in the early- or mid-1900s or even before. In an extreme case, the DuPont family fortune can be traced back to 1802.
There was a proliferation of oil (energy), media, and real estate fortunes in 1982. Combined these three sectors made up 53.2% of the source of wealth for the richest 400 Americans. The percentage who derived their wealth from sectors common today such finance, computer tech, medical tech, and retail or restaurants was low. But that was about to change.
How Do People Get Rich in 2021?
Today, more people are making fortunes by starting companies or managing other peoples’ money. The names of heirs from family dynasties are not too prominent on Forbes’ list. Indeed, the list includes names such as Bezos, Musk, Gates, Buffett, Zuckerburg, Ellison, and Bloomberg. There are heirs from the Walton, Koch and Mars and other families in the top 30, but these are more modern fortunes compared to the family heirs in 1982. The heirs on the 1982 list did not lose their money and the list of America’s richest families shows that the many are still wealthy. However, their relative ranking just dropped. Indeed, by 2013 only about 32.5% of the people on the Forbes list of 400 richest Americans inherited their wealth. It is likely that number has trended down further since then.
Another major change is that the sectors serving as sources of wealth for the richest Americans changed by 2012 and likely continues to evolve. By 2012, fortunes were made predominantly in finance (20.7%), retail or restaurants (16.3%), computer technology (12.0%). Together these three sectors totaled 49%. These sectors were represented on the 1982 list but not to the same degree as in 2012. Hedge funds and private equity existed but the people who ran these were not yet wealthy enough to be amongst the 400 richest Americans. The concept of nationwide retail or restaurant chains was not really there yet with few exceptions. Lastly, computer hardware and software were still in its infancy.
Arguably, the computer technology sector has continued to trend up. In fact, 8 of the top 10 fortunes in the U.S. are based on tech and most of these were self-made rather than inherited. Finance is still a major source of wealth but just not the magnitude of wealth being generated by tech with the exception of Warren Buffett. On the other hand, energy at 9.8% and real estate at 7.3% were much less important than in 2012 and likely continued to trend down.
Final Thoughts on How Do People Get Rich?
Today, people are getting rich by creating technology or inventions that are better than something that preceded it and starting companies. For instance, electric vehicles versus internal combustion engine vehicles and Tesla (TSLA). In many cases, the technology may not have even existed or existed as an idea, such as FaceBook (FB). Who would have thought that a social networking would permit the creation of fifth largest company by market capitalization in the U.S. The point is that in 1982, you pretty much needed to inherit your wealth or be good at cutting deals, which often required family connections. Income and wealth inequality are greater in 2021 than in 1982. This is much like the late-1800s and early-1900s. But unlike in 1982, it is now possible to leverage your skill and knowledge to become rich to a much greater degree.
Chart or Table of the Week
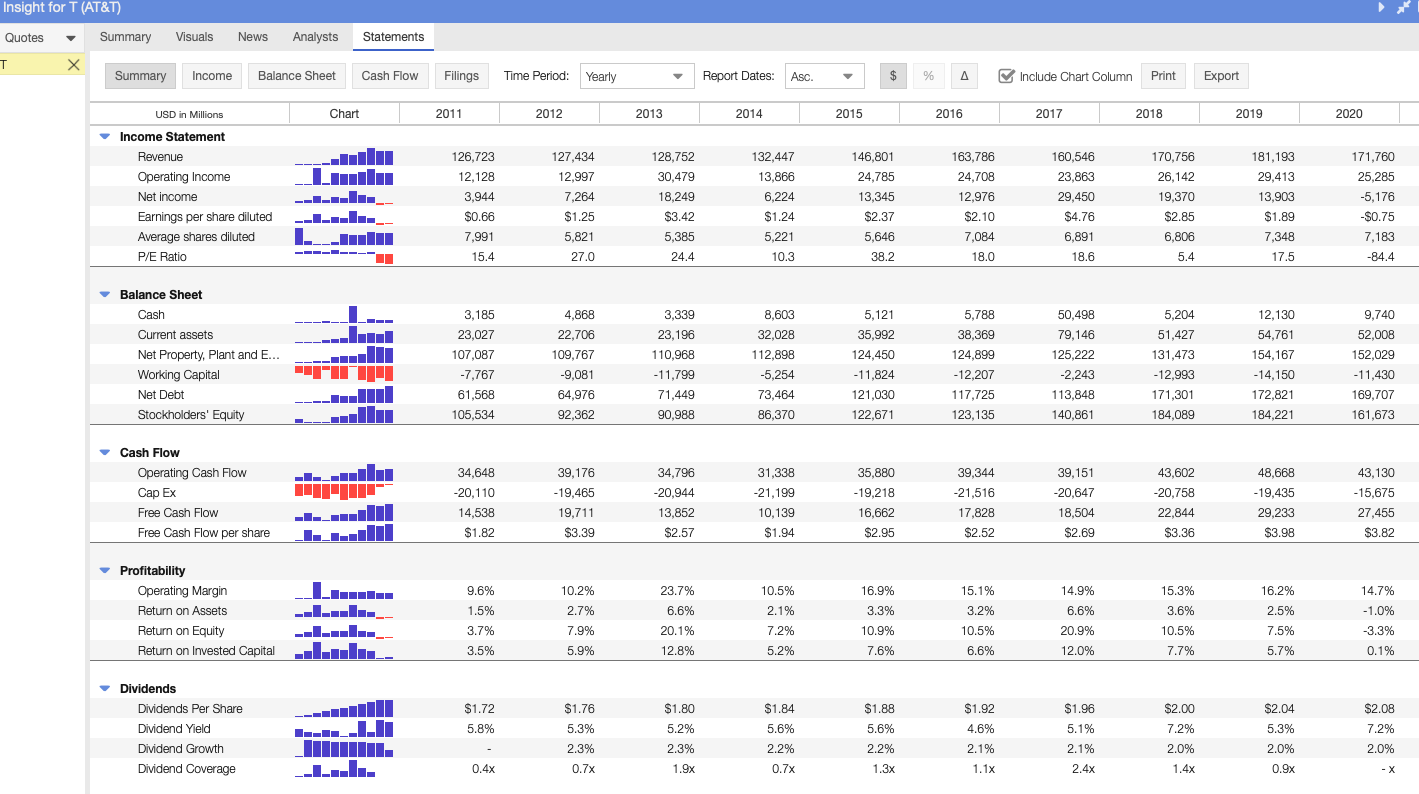
Today I highlight AT&T (T). If you have not heard the news AT&T is refocusing on wireless and fiber and spinning out its media assets. This means that the businesses that came with the Time Warner acquisition only three years ago will be divested into a joint venture. This deal also involves merging with Discovery (DISCA). AT&T’s stock price did not respond favorably and is down about 7% for the week. AT&T shareholders will own about 71% of the new company. But hidden in the details is a roughly 50% dividend cut. AT&T would no longer be a dividend growth stock and this action would effectively remove the company from the list of Dividend Aristocrats. The magnitude of the dividend cut is not clear but is estimated at 45% to 50%. The benefit to AT&T is $43 billion in cash and securities and a reduction in debt. The screenshot below is from Stock Rover*.
Dividend Increases and Reinstatements
I have created a searchable list of dividend increases and reinstatements at the request of a reader. I update this list weekly. You can search for your stocks by company name, ticker, and date.
Dividend Cuts and Suspensions List
I updated my dividend cuts and suspensions list at end of April. The number of companies on the list has risen to 521. We are well over 10% of companies that pay dividends having cut or suspended them since the start of the COVID-19 pandemic.
There were three new companies to add to the list this past month. These three companies were Acadia Realty Trust (AKR), Genie Energy (GNE), and Tri-Continental (TY).
Two companies have made additional cuts or suspended the dividend outright. This includes Antero Midstream (AM) and Geo Group (GEO).
Market Indices
Dow Jones Industrial Averages (DJIA): 34,209 (-0.50%)
NASDAQ: 13,471 (+0.31%)
S&P 500: 4,156 (-0.43%)
Market Valuation
The S&P 500 is trading at a price-to-earnings ratio of 44.2X and the Schiller P/E Ratio is at about 36.9X. These two metrics are down this past week. Note that the long-term means of these two ratios are 15.9X and 16.8X, respectively.
I continue to believe that the market is overvalued at this point. I personally view anything over 30X as overvalued based on historical data. Note that we are near or over 40X and valuation levels near the top of the dot-com era.
S&P 500 PE Ratio

Shiller PE Ratio

Stock Market Volatility – CBOE VIX
The CBOE VIX measuring volatility was up over three full points this past week to 20.15. The long-term average is approximately 19 to 20.

Fear & Greed Index
I also track the Fear & Greed Index. The index is now in Fear at a value of 34. This is down 21 points this past week.
There are seven indicators in the index. They are Put and Call Options, Junk Bond Demand, Market Momentum, Market Volatility, Stock Price Strength, Stock Price Breadth, and Safe Haven Demand.
Junk Bond Demand is indicating Extreme Greed. Investors are accepting 1.97% yield over investment grade corporate bonds. The spread is down further from recent levels indicating that investors are taking on more risk.
Market Momentum is indicating Neutral. The S&P 500 is 6.432% over its 125-day average. This is typical over the past 2-years.
Market Volatility is set at Neutral. The CBOE VIX reading of 20.15 is a neutral reading.
Stock Price Strength is signaling Extreme Fear. The number of stocks hitting 52-week highs compared to those hitting 52-week lows is at the lower end of its range.
Put and Call Options are signaling Extreme Fear. In the last five trading days, put option volume has lagged call option volume by 51.10%. This is amongst the highest level of put buying in the past two years.
Stock Price Breadth is indicating Extreme Fear as advancing volume is 4.60% more than declining volume on the NYSE. Market breadth is improving but it is still near the lower end of its range.
Safe Haven Demand is in Extreme Fear. Stocks and bonds have performed similarly over the past 20 trading days. This is close to the weakest performance over the past 2-years as investors move back into bonds.

Economic News
The U.S. Census Bureau reported that housing starts fell in April coming in at a seasonally adjusted 1.57M, a 9.5% decrease over March’s downwardly revised 1.73M. Single-family starts declined 13.4% to a rate of 1.09M from the revised March rate of 1.26M. However, housing starts are tracking +67.3% year-over-year. New housing permits increased 0.3% in April to a seasonally adjusted 1.76M and are tracking +60.9% year-over-year. Regional new housing permits issued by region reported as follows: Northeast +8.4%, Midwest -9.9%, South +3.9%, and West -4.1%. Housing completions decreased 4.4% to a seasonally adjusted 1.45M and are tracking 21.7 % above April 2020’s 1.19M.
The Department of Labor reported that for the week ending May 15, the advance figure for seasonally adjusted initial jobless claims was 444,000, a decrease of 34,000 from the previous week’s revised level. The 4-week moving average decreased to 504,750, a 30,500 drop from the previous week’s revised average. States with the biggest declines include Georgia (-8,216), Kentucky (-7,175) and Texas (-4,828), while New Jersey (+4,384), Washington (+2,309), and Oklahoma (+2,228) experienced increases.
Markit’s U.S. Flash Purchasing Managers Index (PMI) for May found a continuing acceleration in business activity growth as readings set series record highs. The composite PMI increased from 63.5 in April to a series high 68.1, with increases from both manufacturing (+1.6%) and services (+8.3%). Service providers reported a solid expansion in staffing levels, and manufacturers noted a rise in new orders with improvements coming from greater customer confidence and the further reopening of the economy. While employment rose for the eleventh straight month, the rate of increase slowed due to difficulties filling vacancies. Manufacturers reported higher order volumes due to material shortages and efforts to stockpile ahead of rising costs, in addition new exports rose at a series high pace.
Thanks for reading How Do People Get Rich –Week in Review!
Here are my recommendations:
If you are unsure on how to invest in dividend stocks or are just getting started with dividend investing. Take a look at my Review of the Simply Investing Report. I also provide a Review of the Simply Investing Course. Note that I am an affiliate of Simply Investing.
If you are interested in an excellent resource for DIY dividend growth investors. I suggest reading my Review of The Sure Dividend Newsletter. Note that I am an affiliate of Sure Dividend.
If you want a leading investment research and portfolio management platform with all the fundamental metrics, screens, and analysis tools that you need. Read my Review of Stock Rover. Note that I am an affiliate of Stock Rover.
If you would like notifications as to when my new articles are published, please sign up for my free weekly e-mail. You will receive a free spreadsheet of the Dividend Kings! You will also join thousands of other readers each month!
*This post contains affiliate links meaning that I earn a commission for any purchases that you make at the Affiliates website through these links. This will not incur additional costs for you. Please read my disclosure for more information.
Prakash Kolli is the founder of the Dividend Power site. He is a self-taught investor, analyst, and writer on dividend growth stocks and financial independence. His writings can be found on Seeking Alpha, InvestorPlace, Business Insider, Nasdaq, TalkMarkets, ValueWalk, The Money Show, Forbes, Yahoo Finance, and leading financial sites. In addition, he is part of the Portfolio Insight and Sure Dividend teams. He was recently in the top 1.0% and 100 (73 out of over 13,450) financial bloggers, as tracked by TipRanks (an independent analyst tracking site) for his articles on Seeking Alpha.