
Is It Hard to Get Rich?
Is It Hard to Rich? Before I write about today’s topic, I want to notify you that David Swenson died of cancer at a fairly young age of 67. For those of you who don’t know of him, he was Yale University’s endowment manager since 1985. He was also a giant in the investing world. When he took over Yale had an endowment of $1 billion. By end of June 2020, the endowment was worth $35.1 billion and that included subtracting annual disbursements to Yale. If Swenson had just only invested in the S&P 500 and reinvested the dividends the endowment would be worth about $24 billion. Swenson was well followed by investment professionals but probably not as well-known as Buffett for most retail investors.

How Much Do You Need to be Considered Rich?
This blog is mostly about building wealth. You can qualify getting rich as part of that although many bloggers try to differentiate between the two. Merriam-Webster says the two words are synonyms.
I have pointed out before the incomes and net worth needed to be in the top 10%, which are $145,135 and $1,182,390, respectively. But to get into the top 1% you need an income of $515,371 and a net worth of over $10 million. This is obviously much harder. The numbers vary if you are looking at households or individuals or means and medians. Clearly, you can probably make it to the top 10% for net worth over time. Just map out your net worth target by age and make a plan. It is possible on even an average income. I write a series on Secret Dividend Millionaires who are examples illustrating that it is possible.
It Is Easier to Get Rich in 1980
However, there is an argument to make that it is hard to get rich these days because almost everything is overvalued. Turn back the clock to 1980 and the U.S. just finished a punishing decade with inflation, oil embargos, gas shortages, a shift off the gold standard, end of the Vietnam War etc. But the seeds were sown for a long bull market. The 10-year U.S. Treasury was yielding over 15% and the S&P 500 was yielding over 5% in 1980. Simply buying a holding 10-year bonds provided returns that exceed annualized returns of the stock market over 10-years. At a 15% interest rate the modified Rule of 72 says that your income would double every 4.93 years. Even buying a basket of stocks yielding 5% at the time generated solid returns over time.
It Is Hard to Get Rich in 2021
On the other hand, the S&P 500 is now yielding a paltry ~1.4% and the 10-year bond is yielding 1.66%. Today, it is certainly hard or at least harder to get rich through bonds and stocks comparted to 1980. Bonds will not do it at current yields, and you have to be selective on the stocks you buy. Valuations are elevated if you have been following my weekly reviews which includes data on price-to-earnings ratios. No one really wants to buy overvalued stocks because total returns going forward will be low.
Other asset classes are arguably overvalued. Gold is trading $1842.90 per ounce, not far from the record last year. In 1980, the price of gold was about $600 per ounce but after adjusting for inflation the price of gold would be even higher than it is today. Both commercial and residential real estate are expensive. In 1980, the median home value was roughly $57,530 and at end of 2020 it was approximately $300,987. Housing price growth each year has mostly exceeded the rate of inflation since 1980 with the exception of the period around the sub-prime mortgage crises from 2009 to 2011. Alternative investments like bitcoin have gained an annualized return of 230% in a short time, but this is an extremely volatile and risky investment.
So, the main point is that most investment classes are trading at high valuations or near record prices. Then it follows that it will be much harder today to get rich compared to 1980. The data bears this out. The chart below shows that upward mobility has declined since 1940. At age 30, children of successive generations do not have the same income as their parents and grandparents. In otherwards it is becoming increasingly difficult to have an income greater than your parents.

What about wealth? Well baby boomers had more wealth too than subsequent generations at least to date. Some of this is due to the difficulty of generating returns over time but some is also related to higher debt levels of younger generations. They are burdened with student loans and other debt that makes it hard to build wealth.

Final Thoughts on Is It Hard to Get Rich?
So, the answer is yes, it is hard to get rich but not impossible. It takes a certain amount of discipline. You would need to spend less than you earn, save the difference, and invest to build wealth. Relying solely on your 401(k) plan is probably not enough as the average retiree has only about $182,100 in their plan. You can read about some hints on how to cut your monthly expense. You can also read about what it takes to be a successful investor.
Chart or Table of the Week
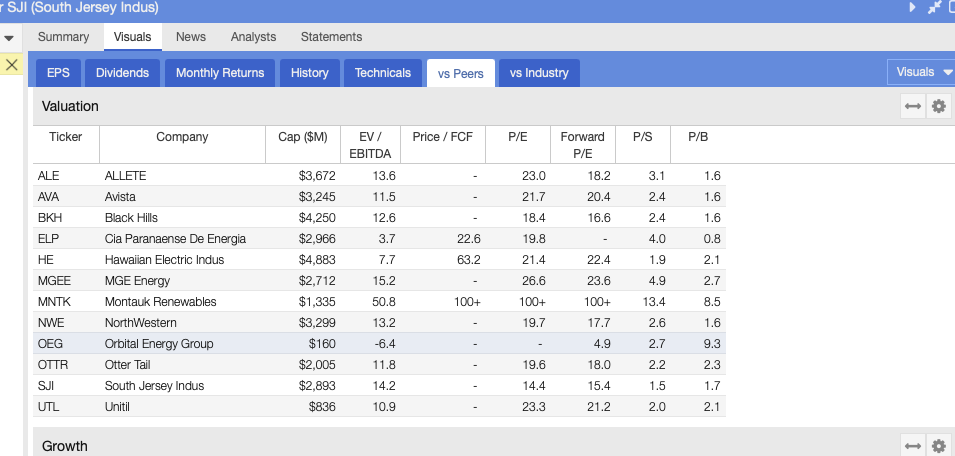
Today I highlight South Jersey Industries (SJI). The company is a natural gas utility with regulated operations in New Jersey and unregulated operations in NJ and mostly Pennsylvania. The stock is a Dividend Contender with 15 consecutive years of dividend growth. Dividend growth has slowed in the past several years as top and bottom line growth has slowed. That being said, most operations are regulated, and the company has a slowly growing rate base that will in turn support a growing dividend. The current dividend yield is 4.7%, more than double that of the S&P 500. The utility is trading at a low valuation relative to its peers. The screenshot below is from Stock Rover*.
Dividend Increases and Reinstatements
I have created a searchable list of dividend increases and reinstatements at the request of a reader. I update this list weekly. You can search for your stocks by company name, ticker, and date.
Dividend Cuts and Suspensions List
I updated my dividend cuts and suspensions list at end of April. The number of companies on the list has risen to 521. We are well over 10% of companies that pay dividends having cut or suspended them since the start of the COVID-19 pandemic.
There were three new companies to add to the list this past month. These three companies were Acadia Realty Trust (AKR), Genie Energy (GNE), and Tri-Continental (TY).
Two companies have made additional cuts or suspended the dividend outright. This includes Antero Midstream (AM) and Geo Group (GEO).
Market Indices
Dow Jones Industrial Averages (DJIA): 34,382 (-1.14%)
NASDAQ: 13,430 (-2.34%)
S&P 500: 4,174 (-1.38%)
Market Valuation
The S&P 500 is trading at a price-to-earnings ratio of 44.3X and the Schiller P/E Ratio is at about 37.3X. These two metrics are down this past week. Note that the long-term means of these two ratios are 15.9X and 16.8X, respectively.
I continue to believe that the market is overvalued at this point. I personally view anything over 30X as overvalued based on historical data. Note that we are near or over 40X and valuation levels near the top of the dot-com era.
S&P 500 PE Ratio

Shiller PE Ratio

Stock Market Volatility – CBOE VIX
The CBOE VIX measuring volatility was up over two full points this past week to 18.81. The long-term average is approximately 19 to 20.

Fear & Greed Index
I also track the Fear & Greed Index. The index is now in Neutral at a value of 40. This is down 15 points this past week.
There are seven indicators in the index. They are Put and Call Options, Junk Bond Demand, Market Momentum, Market Volatility, Stock Price Strength, Stock Price Breadth, and Safe Haven Demand.
Junk Bond Demand is indicating Extreme Greed. Investors are accepting 1.96% yield over investment grade corporate bonds. The spread is down further from recent levels indicating that investors are taking on more risk.
Market Momentum is indicating Greed. The S&P 500 is 7.5% over its 125-day average. This is further above the average than normal over the past 2-years.
Stock Price Strength is signaling Greed. The number of stocks hitting 52-week highs compared to those hitting 52-week lows is at the upper end of its range.
Market Volatility is set at Neutral. The CBOE VIX reading of 18.81 is a neutral reading.
Stock Price Breadth is indicating Extreme Fear as advancing volume is 9.40% more than declining volume on the NYSE. Market breadth is improving but it is still near the lower end of its range.
Safe Haven Demand is in Extreme Fear. Stocks and bonds have provided similar returns over the past 20 trading days. This is close to the weakest performance for stocks over the past 2-years as investors move back into bonds.
Put and Call Options are signaling Extreme Fear. In the last five trading days, put option volume has lagged call option volume by 44.09%. This is amongst the highest level of put buying in the past two years.

Economic News
The U.S. Bureau of Labor Statistics reported a record-high 8.12 million job openings in March. The Job Openings and Labor Turnover Summary (JOLTS) figure is the highest since measurement began in December 2000 and represents a month-to-month increase of 7.9%. Job openings were distributed across the economy, however food services and accommodation (+185,000), state and local education (+155,000), and arts and entertainment (+81,000) reported especially strong figures. Layoffs fell to a record low reading of 1.5 million, decreasing 1.0%. Hiring was up 3.7% in March, increasing to 6.1 million.
The U.S. Bureau of Labor Statistics reported consumer prices increased a seasonally adjusted 0.8% in April, the largest gain since June 2009. The all items index increased 4.2%, the largest 12-month increase since September 2008. A third of the all items increase is attributed to a 10.0% increase in the index for used cars and trucks, the largest increase since 1953. In addition, indexes for shelter, airline fares, recreation, motor vehicle insurance, and household furnishings and operations all increased. The food index gained 0.4%, up 2.4% over the past 12 months. The energy index decreased slightly as gasoline prices fell 1.4% after a 9.1% increase in March. The energy index is up 25.1% over the last 12-months. The index for all items less food and energy rose 0.9% in April, the largest monthly increase since April 1982, it is up 3.0% over the last 12-months.
The Commerce Department reported April’s retail sales were virtually unchanged from March’s revised 10.7% increase. The $619.9 billion is the highest reading yet, exceeding March’s $619.7 billion figure. The April reading is 51.2% higher year over year. Increases in auto purchases (+2.9%) and food services (+3.0%) were offset by decreases in clothing (-5.1%), sporting goods, hobby, musical instruments and book stores (-3.6%), building materials (-0.4%), and online retail (-0.6%). Consumer spending expanded at a 10.7% annualized rate in the first quarter.
Thanks for reading Is It Hard to Get Rich – Week in Review!
Here are my recommendations:
If you are unsure on how to invest in dividend stocks or are just getting started with dividend investing. Take a look at my Review of the Simply Investing Report. I also provide a Review of the Simply Investing Course. Note that I am an affiliate of Simply Investing.
If you are interested in an excellent resource for DIY dividend growth investors. I suggest reading my Review of The Sure Dividend Newsletter. Note that I am an affiliate of Sure Dividend.
If you want a leading investment research and portfolio management platform with all the fundamental metrics, screens, and analysis tools that you need. Read my Review of Stock Rover. Note that I am an affiliate of Stock Rover.
If you would like notifications as to when my new articles are published, please sign up for my free weekly e-mail. You will receive a free spreadsheet of the Dividend Kings! You will also join thousands of other readers each month!
*This post contains affiliate links meaning that I earn a commission for any purchases that you make at the Affiliates website through these links. This will not incur additional costs for you. Please read my disclosure for more information.
Prakash Kolli is the founder of the Dividend Power site. He is a self-taught investor, analyst, and writer on dividend growth stocks and financial independence. His writings can be found on Seeking Alpha, InvestorPlace, Business Insider, Nasdaq, TalkMarkets, ValueWalk, The Money Show, Forbes, Yahoo Finance, and leading financial sites. In addition, he is part of the Portfolio Insight and Sure Dividend teams. He was recently in the top 1.0% and 100 (73 out of over 13,450) financial bloggers, as tracked by TipRanks (an independent analyst tracking site) for his articles on Seeking Alpha.
Hi,
I’m curious about something regarding SJI. On the Stock Rover comp vs. Peers screenshot, none of the other companies are Gas Utilities — they appear to be either Electric or Multi-, and one MNTK is even arguably an Energy company — and the universe of investable Utility stocks is far larger (Fidelity screens for 125).
So, you have any idea of how the list of so-called Peers was constructed? I’d think that a list of Gas Utilities (Fidelity shows 17) might be more appropriate if we’re taking a first cut at comps.
Fidelity is using the GICS classification for each company in its screener as determined by S&P Capital IQ — I have no idea what Stock Rover uses.
Thanks.
Hello,
I looked at the list as well and the I am thinking that the peer group is market cap related. However, that is not completely correct either as one company is under $1 billion and another is much larger. I will reach out to Stock Rover and ask them.
I received a reply from Stock Rover and this is what they said, “The peers shown in Visuals ( and Stock Ratings) are matched based on exchange, industry, total revenue and market capitalization.”
Thanks for doing some research and your responses.
My comment is — needs work. I pulled up the Utilities sector on their website, which has a breakdown of Utilities into various sub-sectors or industries.
South Jersey is there twice, SJI in Utilities-Diversified, and SJIU in Utilities-Regulated Gas.
MNTK is nowhere to be found.
Also, four of the subs are duplicated on the page.
https://www.stockrover.com/help/sectors-stocks/utilities-sector/
Hmmm.
This reminds me of when I questioned SA about related securities whose tickers they show on ‘Breaking News’ stories — they commonly report CEFs as ETFs, and sometimes in the wrong sector. They blamed their data supplier, and of course will not get it fixed.
But don’t feel bad…I was researching ETFs this morning on a well-known and I think highly regarded ETF website. Some of the reported performance for certain ETFs was downright screwy.
Turns out they missed the reverse splits that iShares did in April — and they have an article reporting said splits.
You can’t make this stuff up.
Cheers,
Gary
Yes, I think there are mistakes in most datasets and some more than others. I try to double check between different screeners and sites to make sure.