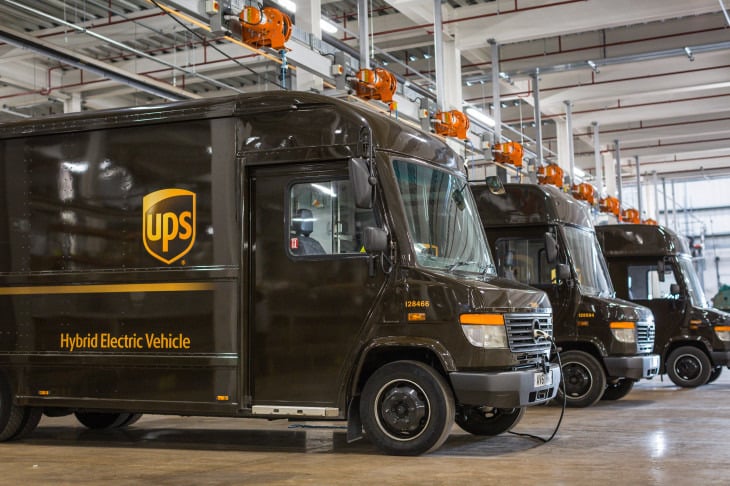
United Parcel Service (UPS) is one of the world’s largest package delivery companies that started from humble beginnings when it was launched in 1907 with a $100 loan to two teenage kids. In 2019, UPS had more than 2,500 operating facilities, delivered 5.5 billion packages and documents, and employed 495,000 people worldwide. Although UPS has paid dividends each year since 1969, they are a Dividend Contender due to maintaining their dividends for two years during the last financial crisis.
Affiliate
Stock Rover is an award winning investment research platform.
- The site has 8,500+ stocks, 4,000 ETFs, and 40,000 mutual funds.
- Access to 650+ metrics, financial data, market news, stock and fund ratings, fair value, margin of safety, etc.
- Includes brokerage integration, portfolio tracking, rebalancing, watchlists, alerts, future income forecasts, etc.
Click here to try Stock Rover for free (14-day free trial).
United Parcel Service Operating Segments
UPS is split into three main operating segments
Domestic Package
UPS offers a full spectrum of U.S. domestic guaranteed air and ground package transportation services. Their Air portfolio enables customers to specify a time-of-day guarantee for their delivery while selecting from the same day, next day, two-day, and three-day delivery alternatives.
They deliver more ground packages in the U.S. than any other carrier, with an average daily package volume of 15 million, most within one to three business days. They also offer UPS SurePost, an economy residential ground service for customers with non-urgent, lightweight residential shipments.
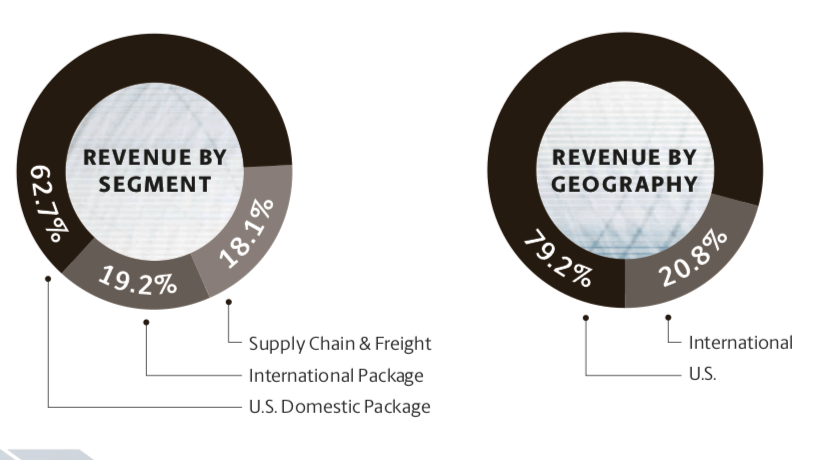
This is their largest segment and in 2019 it generated 62.7% of revenue,
International Package
UPS International Package consists of small package operations in Europe, Asia Pacific, Canada, Latin America and the Indian sub-continent, Middle East and Africa. Europe is the largest region outside of the U.S. and accounts for approximately half of its international small package segment revenue and they have built new hubs in London, Paris, and Eindhoven.
UPS continues to expand their international Express time-definite portfolio which now reaches as many as 220 countries and territories. For international package shipments that do not require Express services, UPS offers a guaranteed day-definite service option.
This is their second largest segment and in 2019 generated 19.2% of revenue.
Supply Chain & Freight Operations
Supply chain complexity creates demand for a global service offering that incorporates transportation, distribution, and international trade and brokerage services, with complementary financial and information services.
Outsourcing non-core logistics activity is a strategy more companies are pursuing. With increased competition and growth opportunities in new markets, businesses require flexible and responsive supply chains to support their strategies. UPS meets this demand by offering a broad array of supply chain services such as forwarding, truckload brokerage, logistics, UPS Freight, and UPS Capital in more than 200 countries and territories.
This is their smallest of the three segments which generated 18.1% of revenue.
The below screenshot will show you the revenue for each segment in 2019.
United Parcel Service Company Growth
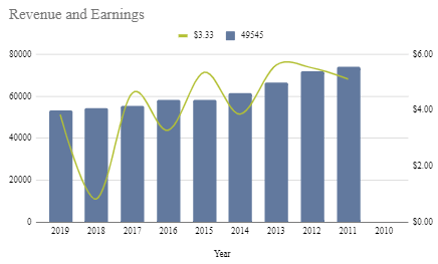
Over the last 10 years revenue has increased from $49,545 million to $74,094 million as of 2019. This gives a CAGR of 4.11%. During the same time EPS has grown from $3.33 to $5.11 which gives a CAGR of 4.38%. It is good to see both Revenue and Earnings growing over a 10-year period, but it is a little bit concerning that earnings have not grown over the last five years.
When examining dividend safety, I like to see the earnings grow at a similar rate to the dividend growth rate to ensure the company can continue to grow the dividend in the future.
United Parcel Service Fiscal 2020 Q3 Earnings Results
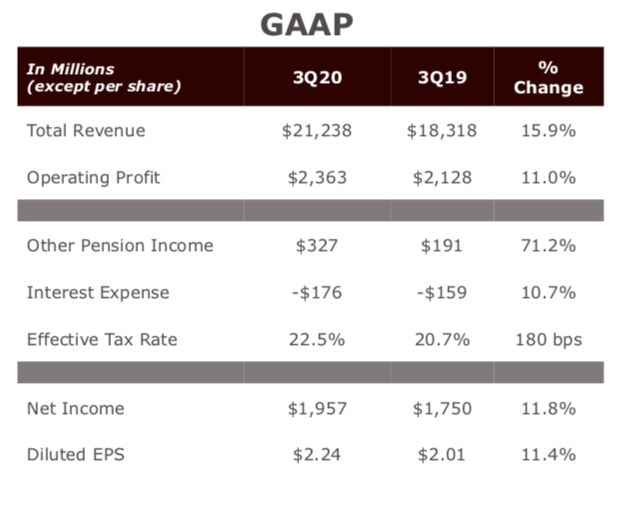
UPS produced a robust Q3 earnings report with a 15.9% increase over the third quarter of 2019. Net Income increased 11.8% to $1,957 million and diluted earnings per share increased 11.4% to $2.24.
Revenue for the US Domestic package increased 15.5% which was driven by ground and deferred products which increased by $1.7 billion. The average daily volume grew 13.8%. International package revenue grew 17% as revenue per piece grew 2.7%. Average daily volume increased 12.1% including strong export growth from Asia. Supply Chain & Freight revenue increased 16.5% which was driven by strong freight forwarding out of Asia.
UPS Dividend Contender
UPS has paid uninterrupted dividends since 1969. UPS is still only considered a Dividend Contender because they held their dividend steady for two years during the last financial crash. The most recent dividend increase came in February 2020 where the dividend was increased by 5.2%. The next dividend payment date is in December where UPS will pay $1.01 per share.

Since 2010 UPS has reduced its share count from 989 million to under 860 million. However, since April 28th, 2020, UPS has suspended share buybacks due to the COVID-19 pandemic.

Payout Ratio
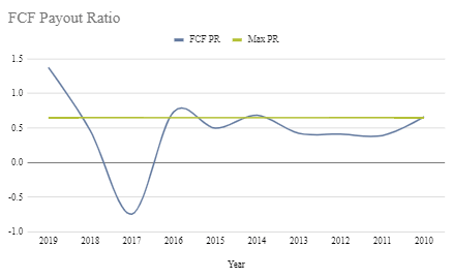
The payout ratio is a good indicator of the sustainability of dividends. I have discussed the different methods for calculating the payout ratio. I like to see dividends covered by both earnings and free cash flow. However, in 2019 the EPS payout ratio was 75.15% which is above the maximum 70% that I like. But more worryingly the FCF payout ratio was 137.44%. These would be warnings signs to me that the dividend may not always be safe in the future.
UPS Dividend Growth – Dividend Contender
Companies that generate sustainable earnings growth often make the best dividend companies, as it is easier to lift the dividend when earnings are rising. Part of my Investment thesis is to invest in companies that show a good history of increasing dividends but also show good potential to continue to raise them.
While UPS is a Dividend Contender and has a strong track record with increasing dividends, the earnings have not been too impressive. Over the last five years, EPS has grown at a CAGR of -0.91% which while the dividend increased 7.46% on average over the same period. This would be a second red flag to me, particularly when we have seen nearly $10 billion worth of share buy backs in that period.
United Parcel Service Financial Strength and Future Proof
Income statement
When starting to analyse a companies’ financial position, I start with the income statement. I generally look through 5 to 10 years of statements where I am interested in the average growth of revenue, net Income, and earnings per share. Basically, I’m looking to see there is a demand for a company’s products, they generate profit after costs and taxes and their earnings are growing.
While not overly impressive, revenue has grown steadily over the last 5- and 10-year period at over 4%. As discussed above earnings have not been too good as it has been relatively flat over the last 5 years. Net Income has also been flat over the same period.
| Growth Rate | |
|---|---|
| Revenue 10-year CAGR | 4.11% |
| Revenue 5-year CAGR | 4.89% |
| Earnings 10-year CAGR | 4.38% |
| Earnings 5-year CAGR | -0.91% |
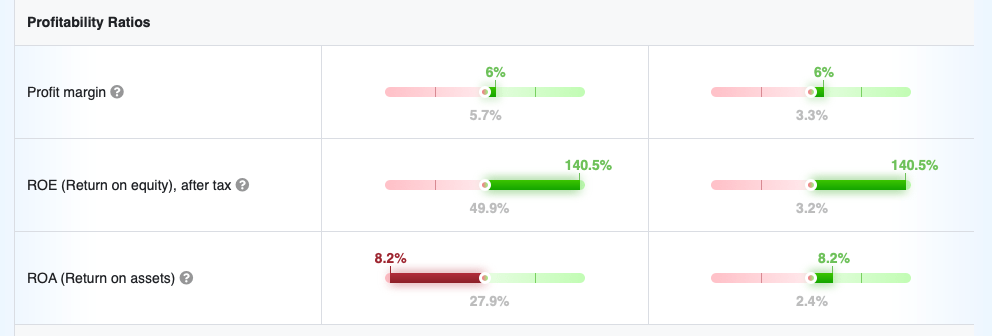
I also note the net profit margin and operating profit margin, over the last 10 years to ensure they are at least maintaining their margins. In 2019 the operating margin was 10.5% which was about the same as the 10-year average of 10.5%. The net margin was 6% is on par with the 10-year average.
While I’m on the income statement I like to compare profitability ratios against the industry.
UPS Balance Sheet
On the balance sheet I like to check the assets and liabilities a company has and to calculate the book value, or shareholder equity. Some of the assets may be listed as “goodwill”. If goodwill and other intangible assets are excluded from total assets when calculating shareholder equity, then you get the tangible book value.
When a company acquires another company and pays a price that is higher than the tangible book value of that company, they will incur a loss on their balance sheet and income statement. To avoid this problem, the acquiring company can put the difference between the purchase price and tangible book value of the acquired company on their balance sheet as “goodwill”. Whenever you see an increased amount of goodwill over a number of years you can assume the company can be buying other businesses. Depending on the business they bought this can be seen as a good thing.
Below is the Goodwill on the balance sheet over the last six years which is no surprise as they have bought companies such as Nightline, Coyote Logistics and Kiala.
| 2014 | 2015 | 2016 | 2017 | 2018 | 2019 | |
| Goodwill and Intangibles | $3,031 | $4,968 | $5,515 | $5,836 | $5,886 | $5,980 |
At the end of 2019, UPS had a D/E ratio of 16.62, which is higher than the industry average of 0.79. Interest coverage is over 9.66X which is far greater than the 3:1 ratio that I look for. The industry average is 17.58X. UPS as an Investment grade A- level which means they are a Low credit risk
UPS Cash Flow Statement
Operating cash flow shows how much cash a company received from operating, after expenses. For me it is good to compare this with the net Income. I am looking for the operating cash flow to be healthy and larger than net income.
Free cash flow is the real cash profit and for me is one of the most important metrics. I like to see a company that has free cash flow equal to at least 65% of net income over the last 10 years. This ensures they have plenty of cash to keep paying us shareholders dividends. In 2019 free cash flow was 52% of net income, however over the last 10 years the average is 140%. Yikes! Cash flow has been a mixed bag over the last 10 years and dividends are not always well covered by both earnings per share and free cash flow.
Dividend Quality
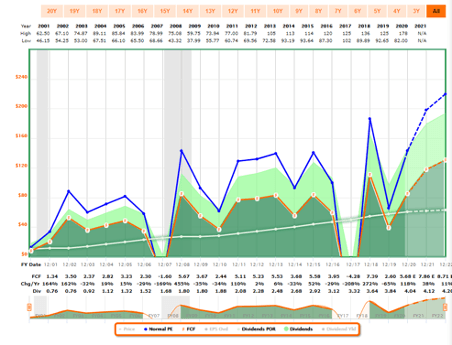
At current prices, I have estimated that it will take over 18 years to reach a yield-on-cost of over 10%. The scoring metric that I use awards 5 points if it takes under 12 years to reach a yield-on-cost of 10% and 3 points in it takes under 15 years.
While their current yield is greater than the SP500 by 147%, I require at least 200% here to give full marks. The dividend growth rate has been stable with 7.46% DGI over the last 5 years and 7.87% over the last 10 years.

UPS Valuation
PE ratio
Looking at the current TTM PE ratio, UPS would look overvalued at 31X earnings. Historically, the average pe ratio has been 17.5X earnings which would give a fair value of $89.50. This would make them undervalued from a PE point of view.
Dividend Discount Model

Using my multistage discount model, the current estimated price is $212.96. I like to use a 10% margin of error which would still make UPS undervalued using the DDM model.
Discounted Cash Flow
Using a discounted cash flow model with a discount rate of 6.25% the fair value for UPS was $177.51

Summary
UPS has some factors that are nice. They have a large moat and should benefit from a growing e-commerce economy. They have a nice dividend yield, and they seem to pride themselves on their dividend and appear fairly valued. UPS is also a Dividend Contender. However, I have some concerns. The high level of debt and the low cash flows really limit the potential for dividend growth in the future. I typically like to invest in companies with lower debt and a stronger balance sheet.
Disclosure: I do not have a position in UPS and upon this review I would not be in a rush to be a shareholder. I feel like there are better opportunities elsewhere.
Related Articles on Dividend Power
Here are my recommendations:
Affiliates
- Simply Investing Report & Analysis Platform or the Course can teach you how to invest in stocks. Try it free for 14 days.
- Free Dividend Kings Spreadsheet from Sure Dividend, complete with Buy/Hold/Sell recommendations, dividend histories, and much more. It is an excellent resource for DIY dividend growth investors and retirees.
- Stock Rover is the leading investment research platform with all the fundamental metrics, screens, and analysis tools you need. Try it free for 14 days.
- Portfolio Insight is the newest and most complete portfolio management tool with built-in stock screeners. Try it free for 14 days.
Receive a free e-book, “Become a Better Investor: 5 Fundamental Metrics to Know!” Join thousands of other readers !
*This post contains affiliate links meaning that I earn a commission for any purchases that you make at the Affiliates website through these links. This will not incur additional costs for you. Please read my disclosure for more information.
Derek
Derek is an entrepreneur, investor, blogger at Engineer my Freedom, and podcast co-host on personal finance on Dividend Talk. His passion is to teach his kids to be financially free and to live life on.
