
Expense Ratios Affect Returns
Expense Ratios Affect Returns. I write quite a bit about stocks and retirement. But on the later topic I have not really spent too much time talking about mutual funds. I do invest in dividend growth stocks and tech stocks and for the most part I invest in passive index funds for retirement. However, like countless people I gave up many years ago trying to pick active mutual funds that can beat the indexes. The days where Peter Lynch, Bill Miller or another star active fund manager can beat the indices year in, and year out is long past. There is too much competition now and the competition is smarter. Furthermore, active funds must overcome higher expense ratios compared to passive index funds. This headwind is often hard to overcome.
Active Mutual Funds Have Higher Expense Ratios
The main problem for actively managed mutual funds is the costs compared to passive index funds. First there is the expense ratio. This is simply the operating expenses of the fund expressed as a percentage of the assets under management or AUM. So, if the expense ratio is 1% then the operating expenses were 1% of AUM. Expense ratios could be the manager’s salary, analysts, administrative costs, custodial services, taxes, legal expenses, accounting, and so on. Fund size can affect expense ratios as the costs are spread out over a larger base. Outflows can cause expense ratios to go up as the asset base becomes smaller.
In general, actively managed funds have higher expense ratios than passive index funds. Active funds tend to have expense ratios between 0.8% and 1.5% although this is not a hard and fast rule of thumb. Passive index funds tend to have expense ratios less than 0.5% but again there are some categories where the expense ratios may be higher. There are index funds with much lower expense ratios. Many ETFs have expense ratios below 0.2%, but they are not the same as a passive index mutual fund. Moreover, many ETFs are actively traded and have high turnover rates suggesting that they are being actively traded. In some cases, there are both a passive index fund and ETF with same holdings and portfolio characteristics, such as VTI vs VTSAX. There are even no fee funds now.
In any case, the table below shows clearly that actively managed mutual funds have higher expense ratios compared to passive index funds. In addition, the expense ratios are decreasing with time whether active or passive.

Active Funds and Passive Funds Will Perform the Same Before Costs
All else being equal, the returns of active mutual funds and passive mutual funds will be equal over time before costs. There is theory to support this at least in aggregate and below are summaries of these theories.
The Efficient Market Hypothesis (EMH) also referred to as the Efficient Market Theory states that current stock prices reflects all the publicly known information about companies and hence they trade at their fair value. Assuming that this is true, then actively managed mutual funds cannot consistently beat the market represented by indices over time.
Sharpe’s Arithmetic of Active Management is a short read but a key paragraph states,
“Over any specified time period, the market return will be a weighted average of the returns on the securities within the market, using beginning market values as weights. Each passive manager will obtain precisely the market return, before costs. From this, it follows (as the night from the day) that the return on the average actively managed dollar must equal the market return. Why? Because the market return must equal a weighted average of the returns on the passive and active segments of the market. If the first two returns are the same, the third must be also.”
Lastly, there is Zero-Sum Game Theory used by Vanguard. This theory states that the aggregate market return is the asset-weighted return of all those invested in the market including active and passive mutual funds. If the market return is the average of all investors, for each investor that outperforms the market, there must be an investor that underperforms the market. Hence, in aggregate the total excess return is zero.
How Expense Ratios Affect Returns
The above theories do not account for how expense ratios affect returns. But logic dictates that if both actively managed mutual funds and passive index funds have the same returns, at least theoretically, before expense ratios are accounted for then the difference in returns are due to expense ratios. So, do low expense ratios actually lead to higher total returns and investor returns. Fortunately, there is a lot of empirical research on this. You can see in the table below that low expense ratios lead to higher total return and higher investor returns in equity funds, particularly in the U.S. The effect is less pronounced in bond funds (not shown) but still there.

The graphs below for U.S. equity funds from a different study demonstrates this point again.

Final Thoughts on Expense Ratios Affect Returns
If you take this thought of how expense ratios affect returns one step further, then the mutual funds that you select for your retirement accounts should have low expense ratios. You can look at a recent article comparing some popular index funds. John Bogle, the father of passive index investing and founder of Vanguard stated it well,
“First, in investing, realize that you get what you don’t pay for. Whatever future returns the markets are generous enough to deliver, few investors will succeed in capturing 100% of those returns, simply because of the high costs of investing—all those commissions, management fees, investment expenses, yes, even taxes—so pare them to the bone.”
This brings us to dividend growth investing and costs. In many cases the costs associated with dividend growth investing are very low, especially since many brokerages are no longer charging commissions on trades. The concept also employs a buy and hold approach. It is inherently tax efficient since taxes on qualified dividends are lower than ordinary income. Take a look at my article on the advantages and risks of dividend growth investing.
Chart or Table of the Week
Today I highlight Gilead Sciences (GILD). Gilead is pharma company that is known for its focus on HIV and hepatitis C (HCV). The company missed consensus estimates for Q1 and the stock price is still down about -24% in the past 1-year. The COVID-19 pandemic adversely affected the company’s sales and business has not yet fully recovered in 2021. Major products include BIKTARVY, DESCOVY, GENVOVA, and SOFOSBUVIR/VELPATASVIR. The company has many potential therapies in its pipeline with a focus on oncology. Gilead is a Dividend Challenger with 7 years of consecutive annual dividend growth. The current yield is roughly 4.5%. The screenshot below is from Stock Rover*.

Dividend Increases and Reinstatements
I have created a searchable list of dividend increases and reinstatements at the request of a reader. I update this list weekly. You can search for your stocks by company name, ticker, and date.
Dividend Cuts and Suspensions List
I updated my dividend cuts and suspensions list at end of April. The number of companies on the list has risen to 521. We are well over 10% of companies that pay dividends having cut or suspended them since the start of the COVID-19 pandemic.
There were three new companies to add to the list this past month. These three companies were Acadia Realty Trust (AKR), Genie Energy (GNE), and Tri-Continental (TY).
Two companies have made additional cuts or suspended the dividend outright. This includes Antero Midstream (AM) and Geo Group (GEO).
Market Indices
Dow Jones Industrial Averages (DJIA): 33,875 (-0.49%)
NASDAQ: 13,963 (-0.38%)
S&P 500: 4,181 (+0.02%)
Market Valuation – Expense Ratios Affect Returns
The S&P 500 is trading at a price-to-earnings ratio of 42.6X and the Schiller P/E Ratio is at about 37.6X. These two metrics are flat with last week. Note that the long-term means of these two ratios are 15.9X and 16.8X, respectively.
I continue to believe that the market is overvalued at this point. I personally view anything over 30X as overvalued based on historical data. Note that we are near or over 40X and valuation levels near the top of the dot-com era.
S&P 500 PE Ratio

Shiller PE Ratio

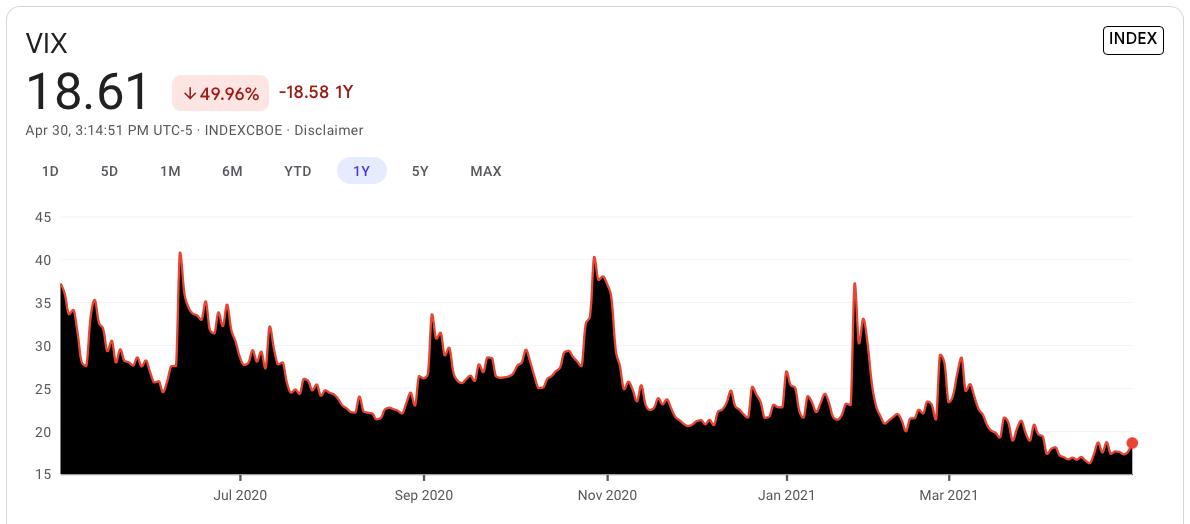
Stock Market Volatility – CBOE VIX
The CBOE VIX measuring volatility was up over a full point this past week to 18.61. The long-term average is approximately 19 to 20.
Fear & Greed Index
I also track the Fear & Greed Index. The index is now in Neutral at a value of 56. This is down 3 points this past week.
There are seven indicators in the index. They are Put and Call Options, Junk Bond Demand, Market Momentum, Market Volatility, Stock Price Strength, Stock Price Breadth, and Safe Haven Demand.
Junk Bond Demand is indicating Extreme Greed. Investors are accepting 1.99% yield over investment grade corporate bonds. The spread is down further from recent levels indicating that investors are taking on more risk.
Stock Price Strength is signaling Extreme Greed. The number of stocks hitting 52-week highs compared to those hitting 52-week lows is at the upper end of its range.
Market Momentum is indicating Greed. The S&P 500 is 9.27% over its 125-day average. This is further above the average than normal over the past 2-years.
Market Volatility is set at Neutral. The CBOE VIX reading of 18.61 is a neutral reading.
Put and Call Options are signaling Fear. In the last five trading days, put option volume has lagged call option volume by 55.51%. This is amongst the highest level of put buying in the past two years.
Stock Price Breadth is indicating Fear as advancing volume is 6.94% more than declining volume on the NYSE. Market breadth is improving but it is still near the lower end of its range.
Safe Haven Demand is in Fear. Stocks have outperformed bonds by 3.56% over the past 20 trading days. This is close to the weakest performance over the past 2-years as investors move back into bonds.

Economic News
The U.S. Census Bureau reported that new orders for manufactured durable goods increased 0.5% to a seasonally adjusted $256.3 billion in March. The increase followed a 0.9% February decrease that was affected by supply chain issues. Aircraft orders sank nearly 50%, on the positive side vehicle orders bounced back up 5.5% in March. Core durable goods shipments increased 1.3% in March and are up 9% year over year. Total durable-goods orders are up 2.4% from a year ago.
The Federal Reserve announced it would continue its easy money policy, keeping its benchmark interest rate near zero as it continues its efforts to bolster a post-pandemic economic recovery. It has been a year since the Fed funds rate was set at 0% to 0.25% down from the previous 1% to 1.25% range. The Fed indicated it won’t change the benchmark interest rate until there is maximum employment, inflation is consistently at 2.0%. The Fed also said it will continue with its asset purchase program, increasing its monthly holdings of Treasury securities by at least $80 Billion and of agency mortgage-backed securities by at least $40 billion.
The U.S. Department of Commerce estimated that gross domestic product (GDP) expanded at a 6.4% annualized rate in Q1, following a 4.3% Q4 pace. Driven by increases in durable goods, nondurable goods, and services personal consumption expenditures (PCE) surged an annualized 10.7%. Business investment rose at an annualized 9.9%, with equipment and intellectual property leading the way, while housing increased at a 10.8% rate. Government spending jumped at a 6.3% annual rate, a reflection of federal stimulus. On the negative side – net exports of goods and services subtracted 0.87% from the GDP while depleting inventories subtracted 2.64 points.
Thanks for reading Expense Ratio Affects Returns – Week in Review!
Here are my recommendations:
If you are unsure on how to invest in dividend stocks or are just getting started with dividend investing. Take a look at my Review of the Simply Investing Report. I also provide a Review of the Simply Investing Course. Note that I am an affiliate of Simply Investing.
If you are interested in an excellent resource for DIY dividend growth investors. I suggest reading my Review of The Sure Dividend Newsletter. Note that I am an affiliate of Sure Dividend.
If you want a leading investment research and portfolio management platform with all the fundamental metrics, screens, and analysis tools that you need. Read my Review of Stock Rover. Note that I am an affiliate of Stock Rover.
If you would like notifications as to when my new articles are published, please sign up for my free weekly e-mail. You will receive a free spreadsheet of the Dividend Kings! You will also join thousands of other readers each month!
*This post contains affiliate links meaning that I earn a commission for any purchases that you make at the Affiliates website through these links. This will not incur additional costs for you. Please read my disclosure for more information.
Prakash Kolli is the founder of the Dividend Power site. He is a self-taught investor, analyst, and writer on dividend growth stocks and financial independence. His writings can be found on Seeking Alpha, InvestorPlace, Business Insider, Nasdaq, TalkMarkets, ValueWalk, The Money Show, Forbes, Yahoo Finance, and leading financial sites. In addition, he is part of the Portfolio Insight and Sure Dividend teams. He was recently in the top 1.0% and 100 (73 out of over 13,450) financial bloggers, as tracked by TipRanks (an independent analyst tracking site) for his articles on Seeking Alpha.
It’s pretty interesting how active funds have much higher expense ratios than passive funds. It’s like “I’m making so many wrong choices but at least I’m still putting in the effort! Pay me more!”
It’s quite amazing how much a “1%” expense ratio can add up to hundreds of thousands over decades of lifetime.
Yes, it costs quite a bit to pay for all the analysts. There are are some good active mutual funds that reform well each year. But for the most part passive index funds are the way to go when a mutual fund is your choice.
Thanks for the informative post. The way you narrated the post is good and understandable. After reading this post I Learned some new things about expense ratios. Keep posting. Please let me know for the upcoming posts.
You’re welcome.
Wise reading with lots of information about expense ratios! Just a quick note to tell you that I have a passion for the topic “expense ratios” at hand. I hope people will learn something new through this reading. Thank you so much and keep it up!
Learned something about “expense ratios” and these are brilliant reading! I hope people will learn something exclusive on the topic. I have please to read all the things above. Thanks!