This article provides an updated list of the Dividend Champions in 2026, select financial data, and analysis. The list and data are updated monthly.
The Dividend Champions 2026 companies on United States stock exchanges have raised their dividend for 25+ consecutive years. This list is a select list of only 154 companies. This number is from nearly 6,000 companies listed on the New York Stock Exchange (NYSE) and NASDAQ in 2026, indicating a success rate of approximately 2.57%.
This list is not one of the best or top Dividend Champions. Instead, it is an informational source to assist in making investment decisions. Lastly, the Dividend Champions list was first created in 2008 by David Fish (deceased in 2018). He originally started the list in the Dividend Investing Resource Center.
Affiliate
Stock Rover is an award winning investment research platform.
- The site has 8,500+ stocks, 4,000 ETFs, and 40,000 mutual funds.
- Access to 650+ metrics, financial data, market news, stock and fund ratings, fair value, margin of safety, etc.
- Includes brokerage integration, portfolio tracking, rebalancing, watchlists, alerts, future income forecasts, etc.
Click here to try Stock Rover for free (14-day free trial).
Market Update for the 2026 Dividend Champions
The Dividend Champions 2026 are currently trading at an elevated valuation of a trailing average price-to-earnings ratio of about 23.39X. This multiple is down from its peak of more than 31X in May 2021. The forward P/E ratio is more reasonable at 17.30 times earnings.
The current average dividend yield is about 2.64%. The average trailing 10-year dividend growth rate is about 6.27%, and the average past 5-year dividend growth rate is around 6.22%. On average, the payout ratio is approximately 55.68%. The mean market cap is currently $59,368 million.
Currently, the Dividend Champion with the highest yield is Universal Health Realty (UHT), the one trading with the lowest trailing earnings multiple is RenaissanceRe Holdings (RNR), and the one with the lowest forward earnings multiple is Novo Nordisk (NVO).
The updated, selected financial data and the dividend earnings calendar for each stock in the Dividend Champions list are in the tables below. The most recent dividend increases are also available to search.
According to Stock Rover*, in the trailing 1-year, the Dividend Champions 2026 have returned +16.6% (blue line) compared to +23.9% for the S&P 500 Index (red line), as seen in the chart below. Over the trailing 5-years, this group of stocks has returned +52.8%, and the S&P 500 has returned +86.8%.

List of Dividend Champions in 2026
Stock Rover* was used to create this table. Sign up to gain access to data, charts, and screeners.
| Ticker | Company Name | No. Years | Dividend Yield (%) | 10-yr Dividend Growth Rate (%) | Payout Ratio (%) | TTM P/E Ratio | Market Cap (millions) |
|---|---|---|---|---|---|---|---|
| ABBV | AbbVie | 54 | 3.10 | 11.70 | 326.00 | n/a | $397,563 |
| ABM | ABM Indus | 58 | 2.60 | 5.80 | 42.50 | 17.3 | $2,626 |
| ABT | Abbott Laboratories | 53 | 2.80 | 9.30 | 66.90 | 25 | $155,256 |
| ADM | Archer-Daniels-Midland | 50 | 2.60 | 5.70 | 91.50 | 36.2 | $39,430 |
| ADP | Automatic Data Processing | 51 | 2.90 | 12.40 | 60.30 | 21.5 | $92,370 |
| AFL | Aflac | 43 | 2.10 | 11.50 | 26.80 | 13.4 | $59,606 |
| ALB | Albemarle | 29 | 1.10 | 2.90 | n/a | n/a | $17,362 |
| ALRS | Alerus Financial | 29 | 2.90 | 6.70 | 78.50 | 28.2 | $744 |
| ANDC | Andover Bancorp | 42 | 3.90 | 0.80 | 35.00 | 9.3 | $39 |
| ANDE | Andersons | 29 | 1.10 | 2.60 | 20.90 | 19.8 | $2,527 |
| AOS | A.O. Smith | 32 | 2.50 | 11.60 | 37.10 | 15.3 | $7,885 |
| APD | Air Products | 43 | 2.60 | 7.70 | 75.90 | 29.2 | $61,573 |
| AROW | Arrow Financial | 29 | 3.20 | 4.30 | 37.50 | 12.3 | $629 |
| ARTNA | Artesian Resources | 33 | 3.80 | 3.60 | 55.00 | 14.7 | $342 |
| ATO | Atmos Energy | 42 | 2.40 | 9.10 | 45.60 | 20.9 | $28,413 |
| ATR | AptarGroup | 32 | 1.70 | 4.80 | 31.50 | 19.6 | $7,317 |
| AWR | American States Water | 71 | 2.60 | 8.40 | 57.70 | 22.9 | $3,077 |
| BANF | BancFirst | 32 | 1.70 | 10.50 | 26.10 | 15.6 | $3,832 |
| BDX | Becton Dickinson | 54 | 2.80 | 4.80 | 105.60 | 25.8 | $40,721 |
| BEN | Franklin Resources | 45 | 4.20 | 6.20 | 99.20 | 23.8 | $16,181 |
| BF.B | Brown-Forman | 42 | 3.50 | 5.40 | 52.90 | 17.5 | $12,259 |
| BKH | Black Hills | 55 | 3.90 | 5.30 | 70.80 | 18.7 | $5,475 |
| BKUT | Bank Of Utica (ny) | 30 | 2.80 | 4.30 | 14.80 | 5.4 | $162 |
| BMI | Badger Meter | 33 | 1.30 | 14.90 | 34.60 | 29 | $3,760 |
| BRC | Brady | 40 | 1.30 | 1.90 | 22.00 | 17.7 | $3,668 |
| BRO | Brown & Brown | 32 | 1.10 | 10.40 | 18.10 | 19.6 | $20,456 |
| CAH | Cardinal Health | 39 | 1.00 | 2.80 | 31.10 | 33 | $50,658 |
| CASS | Cass Information Systems | 25 | 2.60 | 6.70 | 47.00 | 21 | $636 |
| CASY | Casey's General Stores | 26 | 0.30 | 10.00 | 12.60 | 47.7 | $33,799 |
| CAT | Caterpillar | 32 | 0.70 | 7.00 | 29.40 | 42.6 | $394,339 |
| CB | Chubb | 33 | 1.20 | 3.80 | 13.60 | 11.7 | $128,217 |
| CBSH | Commerce Bancshares | 56 | 2.00 | 7.10 | 26.40 | 13.4 | $7,950 |
| CBU | Community Financial Sys | 33 | 2.90 | 4.20 | 45.40 | 15.8 | $3,410 |
| CCFN | Muncy Columbia Financial | 29 | 2.30 | 2.60 | 23.70 | 10.7 | $291 |
| CFR | Cullen/Frost Bankers | 33 | 2.90 | 6.70 | 39.00 | 14.1 | $9,143 |
| CHD | Church & Dwight Co | 29 | 1.30 | 5.60 | 39.10 | 32.3 | $23,264 |
| CHRW | C.H. Robinson Worldwide | 27 | 1.40 | 3.90 | 50.10 | 37.4 | $21,787 |
| CINF | Cincinnati Financial | 65 | 2.30 | 7.00 | 20.10 | 9.5 | $25,740 |
| CL | Colgate-Palmolive | 64 | 2.40 | 3.10 | 80.00 | 34.9 | $71,976 |
| CLX | Clorox | 48 | 5.00 | 4.90 | 80.10 | 16.2 | $12,009 |
| CPKF | Chesapeake Financial | 32 | 2.10 | 6.10 | 15.70 | 8.2 | $161 |
| CSL | Carlisle Companies | 49 | 1.30 | 13.90 | 25.10 | 19.1 | $13,308 |
| CTAS | Cintas | 43 | 1.00 | 18.40 | 36.20 | 38 | $72,188 |
| CTBI | Community Trust Bancorp | 45 | 3.00 | 5.50 | 36.00 | 12.3 | $1,278 |
| CVX | Chevron | 38 | 3.80 | 5.20 | 120.00 | 33.1 | $378,104 |
| CWT | California Water Servs Gr | 58 | 2.80 | 6.90 | 61.80 | 23 | $2,756 |
| DCI | Donaldson | 30 | 1.50 | 5.80 | 31.80 | 22.5 | $9,684 |
| DOV | Dover | 70 | 1.00 | 2.20 | 25.70 | 26.7 | $28,855 |
| EBC | Eastern Bankshares | 26 | 2.60 | n/a | 28.70 | 11.3 | $4,428 |
| ECL | Ecolab | 33 | 1.10 | 7.60 | 37.10 | 34.8 | $72,326 |
| ED | Consolidated Edison | 51 | 3.20 | 2.90 | 57.80 | 18.2 | $39,653 |
| EFSI | Eagle Financial Services | 36 | 2.90 | 4.50 | 32.60 | 11.1 | $229 |
| EMR | Emerson Electric | 69 | 1.60 | 1.60 | 49.80 | 31.8 | $76,794 |
| ENB | Enbridge | 30 | 5.00 | 6.20 | 177.80 | 26.7 | $123,319 |
| EPD | Enterprise Prods Partners | 28 | 5.80 | 3.40 | 80.60 | 14 | $81,932 |
| ERIE | Erie Indemnity | 35 | 2.50 | 7.20 | 46.10 | 21.2 | $12,129 |
| ES | Eversource Energy | 27 | 4.60 | 5.90 | 65.20 | 14.8 | $26,325 |
| ESS | Essex Property Trust | 31 | 3.60 | 4.90 | 115.90 | 32 | $18,291 |
| ETR | Entergy | 32 | 2.30 | 4.20 | 62.30 | 28.2 | $50,586 |
| EXPD | Expeditors International | 31 | 1.00 | 7.30 | 24.80 | 26.6 | $21,652 |
| FAST | Fastenal | 27 | 2.00 | 12.30 | 79.00 | 40.7 | $52,820 |
| FDS | FactSet Research Systems | 26 | 1.90 | 8.80 | 28.10 | 16 | $9,073 |
| FELE | Franklin Electric | 33 | 1.10 | 10.80 | 32.10 | 30 | $4,399 |
| FFMR | First Farmers Financial | 34 | 3.00 | 12.50 | 27.60 | 9.4 | $478 |
| FMAO | Farmers & Merchants | 31 | 3.20 | 7.70 | 34.70 | 10.9 | $393 |
| FMCB | Farmers & Merchants | 60 | 1.60 | 4.60 | 17.90 | 9.6 | $910 |
| FRT | Federal Realty Investment | 58 | 3.70 | 1.90 | 77.70 | 21.4 | $10,679 |
| FUL | H.B. Fuller | 56 | 1.60 | 5.80 | 32.20 | 21.2 | $3,333 |
| GD | General Dynamics | 34 | 1.90 | 7.70 | 37.80 | 21.5 | $92,235 |
| GGG | Graco | 28 | 1.60 | 10.40 | 35.90 | 24 | $12,193 |
| GPC | Genuine Parts | 69 | 4.30 | 4.90 | n/a | 225 | $13,546 |
| GRC | Gorman-Rupp | 53 | 1.00 | 6.10 | 33.50 | 35.5 | $2,103 |
| GWW | W.W. Grainger | 53 | 0.70 | 7.40 | 24.30 | 35.4 | $62,209 |
| HRL | Hormel Foods | 60 | 4.80 | 7.30 | 137.10 | 28.6 | $13,366 |
| HTO | H2O America | 57 | 3.10 | 8.10 | 57.80 | 19.8 | $2,416 |
| IBM | IBM | 31 | 2.50 | 1.90 | 58.30 | 24.1 | $255,986 |
| ITT | ITT | 29 | 0.80 | 12.00 | 25.20 | 32.5 | $16,471 |
| ITW | Illinois Tool Works | 62 | 2.60 | 11.30 | 58.70 | 23.2 | $71,973 |
| JKHY | Jack Henry & Associates | 35 | 1.90 | 8.10 | 32.80 | 17.8 | $9,067 |
| JNJ | Johnson & Johnson | 63 | 2.30 | 5.30 | 59.60 | 27.7 | $574,096 |
| KMB | Kimberly-Clark | 53 | 5.00 | 3.40 | 79.30 | 19.7 | $33,711 |
| KO | Coca-Cola | 63 | 2.50 | 4.20 | 64.60 | 26.3 | $359,643 |
| KVUE | Kenvue | 63 | 4.60 | n/a | 98.50 | 21.5 | $34,655 |
| LECO | Lincoln Electric Holdings | 30 | 1.30 | 9.50 | 31.50 | 26.2 | $13,879 |
| LIN | Linde | 32 | 1.30 | 7.90 | 40.20 | 33.8 | $236,138 |
| LOW | Lowe's Companies | 62 | 2.30 | 15.70 | 40.50 | 18.3 | $121,218 |
| MATW | Matthews International | 33 | 4.00 | 5.40 | 336.70 | 84.9 | $797 |
| MCD | McDonald's | 49 | 2.60 | 7.60 | 59.60 | 23.3 | $200,731 |
| MDT | Medtronic | 47 | 3.60 | 6.50 | 78.60 | 21.5 | $103,030 |
| MGEE | MGE Energy | 50 | 2.50 | 4.90 | 48.10 | 19.9 | $2,930 |
| MGRC | McGrath RentCorp | 33 | 1.70 | 6.90 | 30.80 | 17.9 | $2,776 |
| MKC | McCormick & Co | 39 | 3.90 | 8.40 | 29.90 | 8.2 | $13,361 |
| MO | Altria Group | 55 | 5.80 | 6.50 | 87.70 | 15.3 | $122,118 |
| MSA | MSA Safety | 55 | 1.40 | 5.00 | 28.50 | 21.1 | $6,032 |
| MSEX | Middlesex Water | 53 | 2.60 | 6.10 | 58.30 | 22.4 | $999 |
| MZTI | The Marzetti | 63 | 3.70 | 7.20 | 60.80 | 17.1 | $2,997 |
| NC | NACCO Industries | 40 | 2.00 | -0.20 | 35.10 | 18.5 | $400 |
| NDSN | Nordson | 62 | 1.20 | 13.10 | 34.40 | 29.7 | $15,514 |
| NEE | NextEra Energy | 31 | 2.90 | 11.10 | 58.80 | 21.6 | $177,525 |
| NFG | National Fuel Gas | 55 | 2.80 | 3.10 | 28.70 | 10.4 | $7,329 |
| NIDB | Northeast Indiana Bancorp | 30 | 3.20 | 6.10 | 25.80 | 8.3 | $56 |
| NJR | New Jersey Resources | 30 | 3.40 | 7.10 | 55.30 | 16.6 | $5,632 |
| NNN | NNN REIT | 36 | 5.20 | 3.30 | 116.10 | 22.6 | $8,807 |
| NUE | Nucor | 52 | 0.90 | 4.10 | 22.00 | 24.9 | $57,046 |
| NVO | Novo Nordisk | 29 | 4.20 | 9.80 | 42.50 | 10.1 | $203,843 |
| NWFL | Norwood Financial | 33 | 4.00 | 4.50 | 45.80 | 11.7 | $346 |
| NWN | Northwest Natural Hldg | 70 | 3.90 | 0.50 | 67.10 | 17.1 | $2,103 |
| O | Realty Income | 28 | 5.20 | 3.10 | 265.00 | 51 | $58,171 |
| ORI | Old Republic Intl | 44 | 3.30 | 5.30 | 28.40 | 9.5 | $9,351 |
| OZK | Bank OZK | 32 | 3.60 | 11.70 | 28.90 | 8.3 | $5,571 |
| PEP | PepsiCo | 53 | 4.10 | 7.00 | 89.20 | 22.7 | $197,224 |
| PG | Procter & Gamble | 69 | 2.90 | 5.00 | 60.60 | 21.8 | $347,076 |
| PH | Parker Hannifin | 69 | 0.90 | 12.20 | 26.20 | 32.3 | $110,650 |
| PII | Polaris | 30 | 4.10 | 2.10 | n/a | n/a | $3,819 |
| PNR | Pentair | 49 | 1.50 | -2.00 | 24.80 | 17.9 | $11,538 |
| PPG | PPG Indus | 54 | 2.50 | 5.90 | 39.90 | 16.2 | $25,344 |
| PSBQ | PSB Holdings | 32 | 1.50 | 1.80 | 19.20 | 13.8 | $194 |
| RLI | RLI | 50 | 1.30 | 6.10 | 14.90 | 12.6 | $5,177 |
| RNR | RenaissanceRe Holdings | 30 | 0.60 | 2.80 | 2.70 | 5 | $12,608 |
| ROP | Roper Technologies | 32 | 1.10 | 11.70 | 21.00 | 20.9 | $33,704 |
| RPM | RPM International | 52 | 2.10 | 7.00 | 40.20 | 20.1 | $13,308 |
| RTX | RTX | 31 | 1.60 | 1.00 | 50.40 | 33.2 | $238,914 |
| SBSI | Southside Bancshares | 30 | 4.30 | 4.90 | 60.80 | 14.4 | $1,008 |
| SCL | Stepan | 58 | 3.10 | 7.60 | n/a | n/a | $1,182 |
| SEIC | SEI Investments | 34 | 1.20 | 7.20 | 16.90 | 15.2 | $10,741 |
| SHW | Sherwin-Williams | 47 | 1.10 | 11.10 | 30.10 | 29.2 | $75,149 |
| SJM | JM Smucker | 29 | 3.80 | 5.10 | n/a | n/a | $12,482 |
| SOME | Somerset Trust Holding | 25 | 2.40 | 3.90 | 16.40 | 7 | $183 |
| SON | Sonoco Products | 49 | 4.40 | 3.90 | 20.70 | 8 | $4,894 |
| SPGI | S&P Global | 52 | 0.90 | 10.40 | 24.40 | 27 | $126,501 |
| SRCE | 1st Source | 39 | 2.20 | 9.10 | 23.90 | 11.9 | $1,868 |
| SWK | Stanley Black & Decker | 58 | 4.30 | 4.20 | 135.10 | 31.7 | $12,043 |
| SYK | Stryker | 31 | 1.10 | 8.80 | 39.40 | 35.8 | $118,397 |
| SYY | Sysco | 55 | 2.80 | 5.70 | 59.80 | 21.8 | $37,556 |
| TGT | Target | 57 | 3.60 | 7.40 | 59.70 | 16.9 | $58,118 |
| THFF | First Financial | 31 | 2.90 | 8.00 | 31.50 | 10.9 | $880 |
| TMP | Tompkins Financial | 39 | 3.00 | 4.30 | 21.80 | 7.7 | $1,296 |
| TNC | Tennant | 55 | 1.50 | 4.50 | 71.60 | 50.9 | $1,461 |
| TR | Tootsie Roll Industries | 58 | 0.90 | 3.30 | 26.50 | 29.7 | $2,040 |
| TROW | T. Rowe Price Group | 39 | 4.90 | 9.20 | 54.70 | 11.4 | $22,803 |
| TRP | TC Energy | 25 | 3.70 | 4.50 | 148.90 | 28.3 | $71,079 |
| TYCB | Calvin B. Taylor | 35 | 2.90 | 4.60 | 26.00 | 9.2 | $138 |
| UBSI | United Bankshares | 51 | 3.40 | 1.40 | 41.90 | 12.6 | $6,181 |
| UHT | Universal Health Realty | 38 | 7.40 | 1.50 | 232.00 | 31.5 | $558 |
| UL | Unilever | 43 | 3.90 | 2.90 | 47.00 | 19.7 | $127,852 |
| UMBF | UMB Financial | 34 | 1.30 | 5.80 | 14.50 | 11.6 | $10,019 |
| UVV | Universal | 55 | 6.10 | 4.50 | 251.50 | 41.8 | $1,353 |
| WABC | Westamerica Bancorp | 31 | 3.30 | 2.10 | 41.00 | 12.7 | $1,337 |
| WLY | John Wiley & Sons | 32 | 3.20 | 1.70 | 49.10 | 15.5 | $2,266 |
| WMT | Walmart | 52 | 0.80 | 4.00 | 33.40 | 42.5 | $959,823 |
| WST | West Pharmaceutical Servs | 33 | 0.30 | 6.20 | 11.40 | 44.1 | $23,377 |
| WTRG | Essential Utilities | 34 | 3.70 | 6.80 | 69.10 | 19.2 | $10,655 |
| XOM | Exxon Mobil | 43 | 2.70 | 3.20 | 68.00 | 25.4 | $624,477 |
| YORW | York Water | 28 | 3.00 | 3.90 | 60.80 | 20.6 | $490 |
Dividend Calendar for the Dividend Champions 2026
Stock Rover* was used to create this table. Sign up to track your dividends and income.
| Ticker | Company | Ex-Div. Date | Div. Record Date | Div. Payment Date | Dividend Frequency | Next Div. Payment Per Share | Fwd. Div. Per Share |
|---|---|---|---|---|---|---|---|
| ABBV | AbbVie | 4/15/26 | 4/15/26 | 5/15/26 | 4 | $1.73 | $6.92 |
| ABM | ABM Indus | 7/2/26 | 7/2/26 | 8/3/26 | 4 | $0.29 | $1.16 |
| ABT | Abbott Laboratories | 4/15/26 | 4/15/26 | 5/15/26 | 4 | $0.63 | $2.52 |
| ADM | Archer-Daniels-Midland | 5/20/26 | 5/20/26 | 6/10/26 | 4 | $0.52 | $2.08 |
| ADP | Automatic Data Processing | 6/12/26 | 6/12/26 | 7/1/26 | 4 | $1.70 | $6.80 |
| AFL | Aflac | 5/20/26 | 5/20/26 | 6/1/26 | 4 | $0.61 | $2.44 |
| ALB | Albemarle | 6/12/26 | 6/12/26 | 7/1/26 | 4 | $0.41 | $1.62 |
| ALRS | Alerus Financial | 6/26/26 | 6/26/26 | 7/10/26 | 4 | $0.22 | $0.85 |
| ANDC | Andover Bancorp | 6/10/26 | 6/10/26 | 7/1/26 | 2 | $0.38 | $0.76 |
| ANDE | Andersons | 4/1/26 | 4/1/26 | 4/22/26 | 4 | $0.20 | $0.80 |
| AOS | A.O. Smith | 4/30/26 | 4/30/26 | 5/15/26 | 4 | $0.36 | $1.42 |
| APD | Air Products | 7/1/26 | 7/1/26 | 8/10/26 | 4 | $1.81 | $7.24 |
| AROW | Arrow Financial | 5/12/26 | 5/12/26 | 5/26/26 | 4 | $0.30 | $1.20 |
| ARTNA | Artesian Resources | 5/15/26 | 5/15/26 | 5/29/26 | 4 | $0.32 | $1.25 |
| ATO | Atmos Energy | 5/26/26 | 5/26/26 | 6/8/26 | 4 | $1.00 | $4.00 |
| ATR | AptarGroup | 5/6/26 | 5/6/26 | 5/27/26 | 4 | $0.48 | $1.89 |
| AWR | American States Water | 5/18/26 | 5/18/26 | 6/2/26 | 4 | $0.50 | $2.02 |
| BANF | BancFirst | 6/30/26 | 6/30/26 | 7/15/26 | 4 | $0.49 | $1.96 |
| BDX | Becton Dickinson | 6/9/26 | 6/9/26 | 6/30/26 | 4 | $1.05 | $4.20 |
| BEN | Franklin Resources | 6/29/26 | 6/29/26 | 7/10/26 | 4 | $0.33 | $1.32 |
| BF.B | Brown-Forman | 6/10/26 | 6/10/26 | 7/1/26 | 4 | $0.23 | $0.92 |
| BKH | Black Hills | 5/15/26 | 5/15/26 | 6/1/26 | 4 | $0.70 | $2.81 |
| BKUT | Bank Of Utica (ny) | 12/31/25 | 12/31/25 | 1/20/26 | 2 | $9.75 | $19.25 |
| BMI | Badger Meter | 5/22/26 | 5/22/26 | 6/5/26 | 4 | $0.40 | $1.60 |
| BRC | Brady | 7/10/26 | 7/10/26 | 7/31/26 | 4 | $0.25 | $0.98 |
| BRO | Brown & Brown | 5/11/26 | 5/11/26 | 5/20/26 | 4 | $0.17 | $0.64 |
| CAH | Cardinal Health | 7/1/26 | 7/1/26 | 7/15/26 | 4 | $0.52 | $2.05 |
| CASS | Cass Information Systems | 6/5/26 | 6/5/26 | 6/15/26 | 4 | $0.32 | $1.28 |
| CASY | Casey's General Stores | 5/1/26 | 5/1/26 | 5/15/26 | 4 | $0.57 | $2.28 |
| CAT | Caterpillar | 4/20/26 | 4/20/26 | 5/19/26 | 4 | $1.51 | $6.04 |
| CB | Chubb | 6/12/26 | 6/12/26 | 7/2/26 | 4 | $1.02 | $4.08 |
| CBSH | Commerce Bancshares | 6/5/26 | 6/5/26 | 6/23/26 | 4 | $0.28 | $1.10 |
| CBU | Community Financial Sys | 6/15/26 | 6/15/26 | 7/10/26 | 4 | $0.47 | $1.88 |
| CCFN | Muncy Columbia Financial | 5/26/26 | 5/26/26 | 6/11/26 | 4 | $0.16 | $0.62 |
| CFR | Cullen/Frost Bankers | 5/29/26 | 5/29/26 | 6/15/26 | 4 | $1.03 | $4.12 |
| CHD | Church & Dwight Co | 5/15/26 | 5/15/26 | 6/1/26 | 4 | $0.31 | $1.23 |
| CHRW | C.H. Robinson Worldwide | 6/5/26 | 6/5/26 | 7/2/26 | 4 | $0.63 | $2.52 |
| CINF | Cincinnati Financial | 6/23/26 | 6/23/26 | 7/15/26 | 4 | $0.94 | $3.76 |
| CL | Colgate-Palmolive | 4/20/26 | 4/20/26 | 5/15/26 | 4 | $0.53 | $2.12 |
| CLX | Clorox | 4/22/26 | 4/22/26 | 5/8/26 | 4 | $1.24 | $4.96 |
| CPKF | Chesapeake Financial | 6/1/26 | 6/1/26 | 6/15/26 | 4 | $0.18 | $0.72 |
| CSL | Carlisle Companies | 5/18/26 | 5/18/26 | 6/1/26 | 4 | $1.10 | $4.40 |
| CTAS | Cintas | 5/15/26 | 5/15/26 | 6/15/26 | 4 | $0.45 | $1.80 |
| CTBI | Community Trust Bancorp | 6/15/26 | 6/15/26 | 7/1/26 | 4 | $0.53 | $2.12 |
| CVX | Chevron | 5/19/26 | 5/19/26 | 6/10/26 | 4 | $1.78 | $7.12 |
| CWT | California Water Servs Gr | 5/11/26 | 5/11/26 | 5/22/26 | 4 | $0.34 | $1.27 |
| DCI | Donaldson | 6/15/26 | 6/15/26 | 6/30/26 | 4 | $0.32 | $1.22 |
| DOV | Dover | 5/29/26 | 5/29/26 | 6/15/26 | 4 | $0.52 | $2.08 |
| EBC | Eastern Bankshares | 6/5/26 | 6/5/26 | 6/22/26 | 4 | $0.15 | $0.54 |
| ECL | Ecolab | 6/16/26 | 6/16/26 | 7/15/26 | 4 | $0.73 | $2.92 |
| ED | Consolidated Edison | 5/13/26 | 5/13/26 | 6/15/26 | 4 | $0.89 | $3.47 |
| EFSI | Eagle Financial Services | 5/4/26 | 5/4/26 | 5/15/26 | 4 | $0.31 | $1.24 |
| EMR | Emerson Electric | 5/15/26 | 5/15/26 | 6/10/26 | 4 | $0.56 | $2.22 |
| ENB | Enbridge | 5/15/26 | 5/15/26 | 6/1/26 | 4 | $0.70 | $2.81 |
| EPD | Enterprise Prods Partners | 4/30/26 | 4/30/26 | 5/14/26 | 4 | $0.55 | $2.19 |
| ERIE | Erie Indemnity | 7/7/26 | 7/7/26 | 7/21/26 | 4 | $1.46 | $5.85 |
| ES | Eversource Energy | 5/18/26 | 5/18/26 | 6/30/26 | 4 | $0.79 | $3.15 |
| ESS | Essex Property Trust | 6/30/26 | 6/30/26 | 7/15/26 | 4 | $2.59 | $10.36 |
| ETR | Entergy | 5/1/26 | 5/1/26 | 6/1/26 | 4 | $0.64 | $2.56 |
| EXPD | Expeditors International | 6/1/26 | 6/1/26 | 6/15/26 | 2 | $0.81 | $1.62 |
| FAST | Fastenal | 4/28/26 | 4/28/26 | 5/26/26 | 4 | $0.24 | $0.92 |
| FDS | FactSet Research Systems | 5/29/26 | 5/29/26 | 6/18/26 | 4 | $1.16 | $4.64 |
| FELE | Franklin Electric | 5/7/26 | 5/7/26 | 5/21/26 | 4 | $0.28 | $1.12 |
| FFMR | First Farmers Financial | 3/31/26 | 3/31/26 | 4/15/26 | 4 | $0.52 | $2.08 |
| FMAO | Farmers & Merchants | 4/2/26 | 4/3/26 | 4/20/26 | 4 | $0.23 | $0.91 |
| FMCB | Farmers & Merchants | 6/12/26 | 6/12/26 | 7/1/26 | 4 | $5.35 | $20.50 |
| FRT | Federal Realty Investment | 7/1/26 | 7/1/26 | 7/15/26 | 4 | $1.13 | $4.52 |
| FUL | H.B. Fuller | 4/30/26 | 4/30/26 | 5/14/26 | 4 | $0.25 | $0.98 |
| GD | General Dynamics | 7/2/26 | 7/2/26 | 8/7/26 | 4 | $1.59 | $6.36 |
| GGG | Graco | 4/13/26 | 4/13/26 | 5/6/26 | 4 | $0.29 | $1.18 |
| GPC | Genuine Parts | 6/5/26 | 6/5/26 | 7/2/26 | 4 | $1.06 | $4.25 |
| GRC | Gorman-Rupp | 5/15/26 | 5/15/26 | 6/10/26 | 4 | $0.19 | $0.76 |
| GWW | W.W. Grainger | 5/11/26 | 5/11/26 | 6/1/26 | 4 | $2.49 | $9.27 |
| HRL | Hormel Foods | 7/13/26 | 7/13/26 | 8/17/26 | 4 | $0.29 | $1.17 |
| HTO | H2O America | 5/11/26 | 5/11/26 | 6/1/26 | 4 | $0.44 | $1.76 |
| IBM | IBM | 5/8/26 | 5/8/26 | 6/10/26 | 4 | $1.69 | $6.76 |
| ITT | ITT | 6/8/26 | 6/8/26 | 7/6/26 | 4 | $0.39 | $1.54 |
| ITW | Illinois Tool Works | 6/30/26 | 6/30/26 | 7/10/26 | 4 | $1.61 | $6.44 |
| JKHY | Jack Henry & Associates | 6/1/26 | 6/1/26 | 6/19/26 | 4 | $0.61 | $2.38 |
| JNJ | Johnson & Johnson | 5/26/26 | 5/26/26 | 6/9/26 | 4 | $1.34 | $5.36 |
| KMB | Kimberly-Clark | 6/5/26 | 6/5/26 | 7/2/26 | 4 | $1.28 | $5.12 |
| KO | Coca-Cola | 6/15/26 | 6/15/26 | 7/1/26 | 4 | $0.53 | $2.12 |
| KVUE | Kenvue | 5/13/26 | 5/13/26 | 5/27/26 | 4 | $0.21 | $0.83 |
| LECO | Lincoln Electric Holdings | 6/30/26 | 6/30/26 | 7/15/26 | 4 | $0.79 | $3.16 |
| LIN | Linde | 6/4/26 | 6/4/26 | 6/18/26 | 4 | $1.60 | $6.40 |
| LOW | Lowe's Companies | 7/22/26 | 7/22/26 | 8/5/26 | 4 | $1.25 | $5.00 |
| MATW | Matthews International | 5/11/26 | 5/11/26 | 5/25/26 | 4 | $0.25 | $1.02 |
| MCD | McDonald's | 6/2/26 | 6/2/26 | 6/16/26 | 4 | $1.86 | $7.44 |
| MDT | Medtronic | 6/26/26 | 6/26/26 | 7/17/26 | 4 | $0.72 | $2.88 |
| MGEE | MGE Energy | 6/1/26 | 6/1/26 | 6/15/26 | 4 | $0.47 | $1.90 |
| MGRC | McGrath RentCorp | 7/17/26 | 7/17/26 | 7/31/26 | 4 | $0.50 | $1.96 |
| MKC | McCormick & Co | 4/20/26 | 4/20/26 | 4/27/26 | 4 | $0.48 | $1.92 |
| MO | Altria Group | 6/15/26 | 6/15/26 | 7/10/26 | 4 | $1.06 | $4.24 |
| MSA | MSA Safety | 5/15/26 | 5/15/26 | 6/10/26 | 4 | $0.54 | $2.16 |
| MSEX | Middlesex Water | 5/15/26 | 5/15/26 | 6/1/26 | 4 | $0.36 | $1.42 |
| MZTI | The Marzetti | 6/5/26 | 6/5/26 | 6/30/26 | 4 | $1.00 | $4.00 |
| NC | NACCO Industries | 6/1/26 | 6/1/26 | 6/15/26 | 4 | $0.26 | $1.05 |
| NDSN | Nordson | 6/18/26 | 6/18/26 | 7/6/26 | 4 | $0.82 | $3.28 |
| NEE | NextEra Energy | 6/5/26 | 6/5/26 | 6/15/26 | 4 | $0.62 | $2.49 |
| NFG | National Fuel Gas | 3/31/26 | 3/31/26 | 4/15/26 | 4 | $0.54 | $2.14 |
| NIDB | Northeast Indiana Bancorp | 5/14/26 | 5/14/26 | 5/28/26 | 4 | $0.19 | $0.76 |
| NJR | New Jersey Resources | 6/10/26 | 6/10/26 | 7/1/26 | 4 | $0.47 | $1.90 |
| NNN | NNN REIT | 4/30/26 | 4/30/26 | 5/15/26 | 4 | $0.60 | $2.40 |
| NUE | Nucor | 3/31/26 | 3/31/26 | 5/11/26 | 4 | $0.56 | $2.24 |
| NVO | Novo Nordisk | 3/30/26 | 3/30/26 | 4/8/26 | 2 | $1.22 | $1.80 |
| NWFL | Norwood Financial | 4/15/26 | 4/15/26 | 5/1/26 | 4 | $0.32 | $1.28 |
| NWN | Northwest Natural Hldg | 4/30/26 | 4/30/26 | 5/15/26 | 4 | $0.49 | $1.97 |
| O | Realty Income | 5/29/26 | 5/29/26 | 6/15/26 | 12 | $0.27 | $3.25 |
| ORI | Old Republic Intl | 6/5/26 | 6/5/26 | 6/15/26 | 4 | $0.31 | $1.26 |
| OZK | Bank OZK | 4/13/26 | 4/13/26 | 4/20/26 | 4 | $0.47 | $1.82 |
| PEP | PepsiCo | 6/5/26 | 6/5/26 | 6/30/26 | 4 | $1.48 | $5.92 |
| PG | Procter & Gamble | 4/24/26 | 4/24/26 | 5/15/26 | 4 | $1.09 | $4.26 |
| PH | Parker Hannifin | 5/8/26 | 5/8/26 | 6/5/26 | 4 | $2.00 | $8.00 |
| PII | Polaris | 6/1/26 | 6/1/26 | 6/15/26 | 4 | $0.68 | $2.72 |
| PNR | Pentair | 7/24/26 | 7/24/26 | 8/7/26 | 4 | $0.27 | $1.06 |
| PPG | PPG Indus | 5/11/26 | 5/11/26 | 6/12/26 | 4 | $0.71 | $2.84 |
| PSBQ | PSB Holdings | 4/10/26 | 4/10/26 | 4/30/26 | 4 | $0.18 | $0.72 |
| RLI | RLI | 5/29/26 | 5/29/26 | 6/12/26 | 4 | $0.18 | $0.72 |
| RNR | RenaissanceRe Holdings | 6/15/26 | 6/15/26 | 6/30/26 | 4 | $0.41 | $1.64 |
| ROP | Roper Technologies | 7/8/26 | 7/8/26 | 7/22/26 | 4 | $0.91 | $3.64 |
| RPM | RPM International | 4/16/26 | 4/16/26 | 4/30/26 | 4 | $0.54 | $2.16 |
| RTX | RTX | 5/22/26 | 5/22/26 | 6/11/26 | 4 | $0.73 | $2.77 |
| SBSI | Southside Bancshares | 5/18/26 | 5/18/26 | 6/1/26 | 4 | $0.36 | $1.44 |
| SCL | Stepan | 6/1/26 | 6/1/26 | 6/15/26 | 4 | $0.40 | $1.58 |
| SEIC | SEI Investments | 6/8/26 | 6/8/26 | 6/16/26 | 2 | $0.52 | $1.04 |
| SHW | Sherwin-Williams | 5/22/26 | 5/22/26 | 6/5/26 | 4 | $0.80 | $3.20 |
| SJM | JM Smucker | 5/15/26 | 5/15/26 | 6/1/26 | 4 | $1.10 | $4.40 |
| SOME | Somerset Trust Holding | 6/10/26 | 6/10/26 | 6/19/26 | 4 | $0.44 | $1.76 |
| SON | Sonoco Products | 5/8/26 | 5/8/26 | 6/10/26 | 4 | $0.54 | $2.13 |
| SPGI | S&P Global | 5/29/26 | 5/29/26 | 6/10/26 | 4 | $0.97 | $3.88 |
| SRCE | 1st Source | 5/5/26 | 5/5/26 | 5/15/26 | 4 | $0.43 | $1.72 |
| SWK | Stanley Black & Decker | 6/8/26 | 6/8/26 | 6/23/26 | 4 | $0.83 | $3.32 |
| SYK | Stryker | 6/30/26 | 6/30/26 | 7/31/26 | 4 | $0.88 | $3.52 |
| SYY | Sysco | 7/2/26 | 7/2/26 | 7/24/26 | 4 | $0.55 | $2.20 |
| TGT | Target | 5/13/26 | 5/13/26 | 6/1/26 | 4 | $1.14 | $4.56 |
| THFF | First Financial | 4/1/26 | 4/1/26 | 4/15/26 | 4 | $0.56 | $2.14 |
| TMP | Tompkins Financial | 5/8/26 | 5/8/26 | 5/15/26 | 4 | $0.67 | $2.68 |
| TNC | Tennant | 5/29/26 | 5/29/26 | 6/15/26 | 4 | $0.31 | $1.24 |
| TR | Tootsie Roll Industries | 6/18/26 | 6/18/26 | 7/9/26 | 4 | $0.09 | $0.36 |
| TROW | T. Rowe Price Group | 6/15/26 | 6/15/26 | 6/29/26 | 4 | $1.30 | $5.20 |
| TRP | TC Energy | 6/30/26 | 6/30/26 | 7/31/26 | 4 | $0.63 | $2.57 |
| TYCB | Calvin B. Taylor | 4/27/26 | 4/27/26 | 5/7/26 | 4 | $0.38 | $1.52 |
| UBSI | United Bankshares | 6/12/26 | 6/12/26 | 7/1/26 | 4 | $0.38 | $1.52 |
| UHT | Universal Health Realty | 3/23/26 | 3/23/26 | 3/31/26 | 4 | $0.75 | $2.98 |
| UL | Unilever | 5/15/26 | 5/15/26 | 6/26/26 | 4 | $0.54 | $2.28 |
| UMBF | UMB Financial | 6/10/26 | 6/10/26 | 7/1/26 | 4 | $0.43 | $1.72 |
| UVV | Universal | 7/13/26 | 7/13/26 | 8/3/26 | 4 | $0.83 | $3.32 |
| WABC | Westamerica Bancorp | 5/4/26 | 5/4/26 | 5/15/26 | 4 | $0.48 | $1.86 |
| WLY | John Wiley & Sons | 4/7/26 | 4/7/26 | 4/23/26 | 4 | $0.35 | $1.42 |
| WMT | Walmart | 8/21/26 | 8/21/26 | 9/8/26 | 4 | $0.25 | $0.99 |
| WST | West Pharmaceutical Servs | 4/29/26 | 4/29/26 | 5/6/26 | 4 | $0.22 | $0.88 |
| WTRG | Essential Utilities | 5/12/26 | 5/12/26 | 6/1/26 | 4 | $0.34 | $1.37 |
| XOM | Exxon Mobil | 5/15/26 | 5/15/26 | 6/10/26 | 4 | $1.03 | $4.12 |
| YORW | York Water | 6/30/26 | 6/30/26 | 7/15/26 | 4 | $0.23 | $0.91 |
Promotions to Dividend Kings in 2025
In 2025, Automatic Data Processing (ADP), Pentair (PNR), RLI (RLI), and United Bankshares (UBSI) were added to the list of Dividend Kings.
Additions to the Dividend Champions in 2025
In 2025, Cass Information Systems (CASS), Somerset Trust Holdings (SOME), and TC Energy (TRP) were added to the list of Dividend Champions.
Cass Information Systems is a payment and information processing company for manufacturing, distribution, and retail businesses.
Somerset Trust Holdings is a small bank holding company in Pennsylvania.
TC Energy is a Canadian energy company that owns and operates pipelines, LNG terminals, gas storage facilities, and power generation facilities.
Deletions to the Dividend Champions in 2025
In 2025, no Dividend Champions fell off the list because of dividend cuts or freezes.
Other Dividend Stock Lists
The other U.S. stock lists are:
- Dividend Kings in 2026
- Dividend Aristocrats in 2026
- Dividend Contenders in 2025
- Dividend Challengers in 2025
- Dogs of the Dow in 2026
For Canadian stocks, we have an article on
For UK stocks, we have an article on
Other dividend stock lists
FAQs About the 2026 Dividend Champions
What do I like About the Dividend Champions 2026?
The Dividend Champions 2026 list is a screen for further investigating stocks for a dividend growth portfolio. It is a list of companies with stable businesses that have competitive advantages and have returned cash to shareholders consistently through dividends and, in some cases, buybacks over an extended period.
Over-The-Counter Stocks Increase the Number
The number of Dividend Champions increases if we include over-the-counter (OTC) stocks. As a result, the total universe of U.S. stocks goes up to about 12,000. We have added many of these stocks to our list in 2026, increasing the number of Dividend Champions by about 20 from earlier years.
In addition, the list changes slowly. However, even during extreme economic duress, such as the COVID-19 pandemic, only a handful of companies dropped off the list each year. This fact points to the resiliency of the businesses on the Dividend Champions 2026 list and management’s commitment to the dividend.
What are the Differences Between the Dividend Champions and Dividend Aristocrats
The Dividend Champion 2026 list is broader and more comprehensive than the Dividend Aristocrat list. A stock must only meet the requirement for raising the dividend for 25+ years to be added to the Dividend Champions List. However, the criteria for inclusion as a Dividend Aristocrat are stricter. In addition to the 25+ years of dividend increases, a stock must be a part of the S&P 500 Index, have a minimum market capitalization of $3 billion, and meet trading volume and sector weighting requirements.
Hence, a stock can be a Dividend Champion but not a Dividend Aristocrat.
What are the Differences Between Dividend Champions and Dividend Kings
The Dividend Kings are more exclusive than the Dividend Champions. To become a Dividend King, a stock must raise its dividend for 50+ consecutive years, a much harder achievement. However, a company can be a Dividend King, a Dividend Champion, and a Dividend Aristocrat. For instance, The Coca-Cola Company (KO) is found on all three lists.
Two MLPs and Six REITs Are on the Dividend Champions 2026 List
The 2026 Dividend Champions list contains many banks, utilities, consumer defensive, and industrial companies.
The list includes three Master Limited Partnerships (MLPs): Enbridge (ENB), Enterprise Products Partners (EPD), and TC Energy (TRP).
The Dividend Champions list has five Real Estate Investment Trusts (REITs): Essex Property Trust (ESS), Federal Realty Investment (FRT), National Retail Properties (NNN), Realty Income (O), and Universal Health Realty (UHT).
In addition, W.P. Carey will fall off the list in 2026 because it reduced the quarterly payout.
Related Articles About REITs on Dividend Power
- Essex Property Trust (ESS): Undervalued REIT
- Best REITs for Safe Income
- Federal Realty (FRT): A Dividend King REIT
- 3 Dividend Aristocrat REITs
What is the Sector and Industry Breakdown?
Companies from the Financial sector have the most significant representation on the Dividend Champions 2026 list, with 42 companies, followed by the Industrial sector, with 30 companies. The Consumer Defensive sector has 22, and the Utilities sector has 16 Companies. The lowest representation is from the Communications Services sector, with one company.

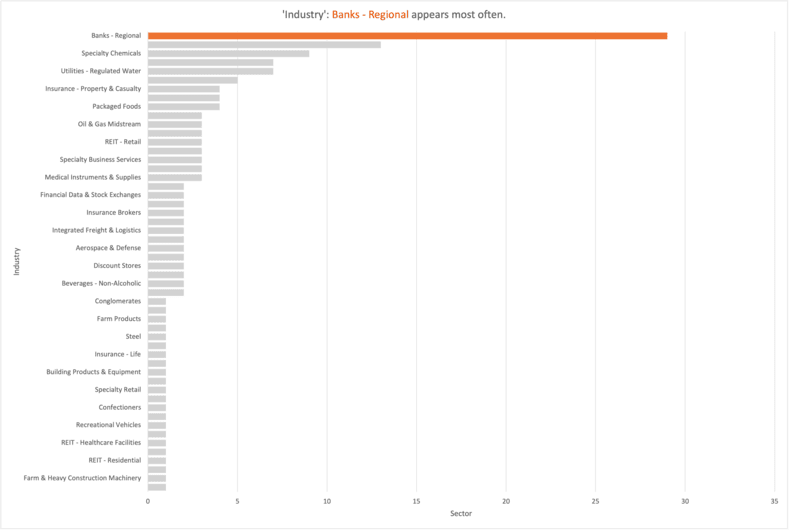
Financials tend to have stable and generally rising earnings over time. There are 29 regional banks, six insurance companies, three asset managers, and two financial data & stock exchange companies on the list of Dividend Champions. Regional banks are often conservative; they have room to expand, allowing for earnings per share and dividend growth. Insurance and asset manager companies have sticky customers and grow with time.
Industrial companies tend to have somewhat more volatile earnings and cash flows, but many have conservative payout ratios, allowing them to grow dividends during recessions and economic downturns. The list includes 13 specialty industrial machinery companies, two aerospace & defense companies, one conglomerate, as well as others.
Consumer Defensive companies tend to have predictable earnings and cash flows that grow slowly with time. Many did well during the COVID-19 pandemic. Larger companies in this sector tend to acquire smaller ones, leading to industry consolidation. Seven household & personal products companies and four packaged food companies are on the list, including several well-known ones.
Market Size of the Dividend Champions 2026
Large-cap companies do not dominate the list, which includes quite a few mid-cap ($2 billion – $10 billion) and small-cap ($300 million – $2 billion) companies.
Walmart (WMT) is the largest dividend champion by market capitalization, and Andover Bancorp (ANDC) is the smallest.
Who’s On Deck?
At the start of the year, several companies on the Dividend Contender List have raised the dividend for 24 years. This number includes L3 Harris Technologies (LHX), Nike (NKE), Royal Gold (RGLD), and Southern (SO). These stocks will become Dividend Champions, assuming they raise their dividend in 2026.
Prior Year Lists and Articles
- List of Dividend Champions in 2025
- List of Dividend Champions in 2024
- List of Dividend Champions in 2023
- List of Dividend Champions in 2022
- List of Dividend Champions in 2021
- List of Dividend Champions in 2020
- List of Dividend Champions in 2019
Here are my recommendations:
Affiliates
- Simply Investing Report & Analysis Platform or the Course can teach you how to invest in stocks. Try it free for 14 days.
- Free Dividend Kings Spreadsheet from Sure Dividend, complete with Buy/Hold/Sell recommendations, dividend histories, and much more. It is an excellent resource for DIY dividend growth investors and retirees.
- Stock Rover is the leading investment research platform with all the fundamental metrics, screens, and analysis tools you need. Try it free for 14 days.
Receive a free e-book, “Become a Better Investor: 5 Fundamental Metrics to Know!” Join thousands of other readers !
*This post contains affiliate links meaning that I earn a commission for any purchases that you make at the Affiliates website through these links. This will not incur additional costs for you. Please read my disclosure for more information.
Prakash Kolli is the founder of the Dividend Power site. He is a self-taught investor, analyst, and writer on dividend growth stocks and financial independence. His writings can be found on Seeking Alpha, InvestorPlace, Business Insider, Nasdaq, TalkMarkets, ValueWalk, The Money Show, Forbes, Yahoo Finance, and leading financial sites. In addition, he is part of the Portfolio Insight and Sure Dividend teams. He was recently in the top 1.0% and 100 (73 out of over 13,450) financial bloggers, as tracked by TipRanks (an independent analyst tracking site) for his articles on Seeking Alpha.