
The Dividend Champions 2020 are U.S. stocks that that have grown their dividend for 25+ years in a row. This is a fairly select list as only 138 companies have successfully done so as of November 30, 2020. This is out of the over 4,300 companies listed on stock exchanges at end of 2018. These companies have survived periods of inflation, stock market crashes, global crisis and deep recessions. They may not have grown revenue and earnings per share every year, but they annually raised the dividend without fail for 25 years straight.
Note that the Dividend Champion 2020 list is broader and more encompassing than the Dividend Aristocrat List. The latter requires membership in the S&P 500 and having a minimum market capitalization of $3 billion. It is possible for a stock to be a Dividend Champion but not a Dividend Aristocrat for this reason. Currently, there are only 65 Dividend Aristocrats as of this writing.
A subset of the Dividend Champions has raised the divided for 50+ consecutive years. These stocks are collectively known as the Dividend Kings. I track these stocks separately since getting from 25-years of dividend increases to 50+ years of dividend growth is no easy task. In fact there are only 31 Dividend Kings as of this writing. It is possible for a company to be a Dividend King, a Dividend Champion, and a Dividend Aristocrat. For instance, The Coca-Cola Company (KO) is found on all three lists.
Affiliate
Free Dividend Kings Spreadsheet from Sure Dividend, complete with Buy/Hold/Sell recommendations, dividend histories, and much more.
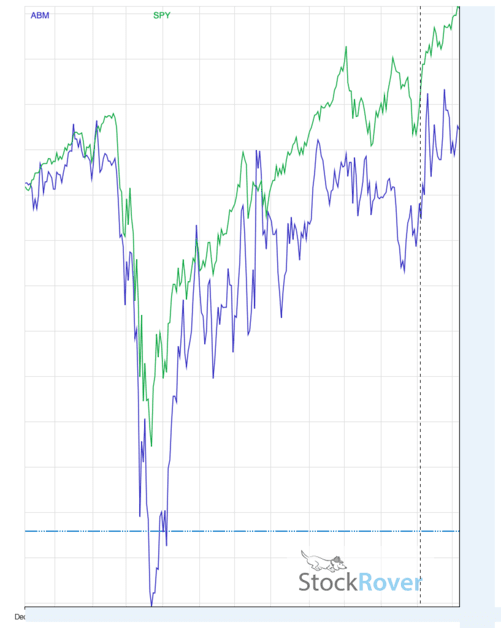
Performance Update for the Dividend Champions 2020
The Dividend Champions 2020 are currently (as of November 30, 2020) trading at an elevated valuation of a trailing average price-to-earnings ratio of about 29.0X. The current average dividend yield is about 2.7%. The trailing average 10-year dividend growth rate is about 7.8%. The average payout ratio is approximately 77.8%. The average market cap is currently $40,152 million. Currently, the Dividend Champion with the highest yield is ExxonMobil (XOM), and the one trading with the lowest earnings multiple is AFLAC (AFL). You can take a look at updated select financial data for each stock in the Dividend Champions 2020 list in the table at end of the article.
In the trailing 1-year the Dividend Champions 2020 as a group have returned +7.8% as a group compared to +20.6% for the S&P 500 (as measured by SPY), as seen in the chart below. I used Stock Rover* to for this chart. Over the trailing 5-years the Dividend Champions have returned +91.1% and the S&P 500 has returned +94.3%.
Changes to the Dividend Champions in 2020
As of this writing several Dividend Champions 2020 have cut or suspended their dividends due to COVID-19. You can take a look at my article on the Coronavirus Dividend Cuts or Suspensions. I update this list weekly. Companies that have fallen off the list include Urstadt-Biddle Properties (UBA), Tanger Factory Outlet Centers (SKT), Meredith Corporation (MDP), Ross Stores (ROST), and Helmerich & Payne (HP). I have written articles on the dividend cuts or suspensions of all these stocks.
- Urstadt-Biddle Properties (UBA) Dividend Cut
- Tanger Factory Outlet Centers (SKT): Another Fallen Dividend Champion
- Meredith Corporation (MDP) Dividend Suspension
- Ross Stores (ROST): A Dividend Aristocrat Suspended Its Dividend
- Helmerich & Payne (HP): A Fallen Dividend Champion
United Technologies Corp. (UTX) has fallen off the list since it merged with Raytheon (RTN) and formed Raytheon Technologies Corp. (RTX). RTX was on the List of Dividend Champions as the successor organization after the merger. As part of the transaction Otis Worldwide Corporation (OTIS) and Carrier Global Corporation (CARR) were spun off. Neither OTIS nor CARR are on the Dividend Champions List. Note that RTX, OTIS, and CARR are all still on the Dividend Aristocrats list. RTX is no longer on the Dividend Champions list as of November 30, 2020 since the dividend was held constant.
Additions to this list include International Business Machines (IBM), Polaris Inc (PII), RenaissanceRe Holdings (RNR), New Jersey Resources (NJR, Southside Bancshares (SBSI), Canadian National Railways (CNI), First of Long Island Corp (FLIC), and Matthews International (MATW).
Other Dividend Stock Lists
The other U.S. stock lists are:
- List of Dividend Kings in 2020
- List of Dividend Aristocrats in 2020
- List of Dividend Contenders in 2020
- List of Dividend Challengers in 2020
- Dogs of the Dow in 2020
For Canadian stock I have recently updated my article on
For UK stocks I have an article on
Some Details on the Dividend Champions 2020
The stock with the longest track record as a Dividend Champions with 66 straight years of dividend increases is American States Water (AWR). There are two stocks with 65 consecutive years of annual dividend increases: Dover Corp (DOV) and Northwest Natural Gas (NWN). There are two stocks with 64 consecutive years of dividend increases: Genuine Parts Co. (GPC) and Procter & Gamble (PG). All of these stocks are also Dividend Kings.
The newest entries on the list with 25 consecutive years of dividend increases are Canadian National Railway (CNI), International Business Machines (IBM), Lincoln Electric Holdings (LECO), Matthews International (MATW), Northeast Indiana Bancorp (NIDB), Polaris Industries (PII), RenaissanceRe Holdings (RNR), and Southside Bancshares (SBSI).
The 2020 Dividend Champions list contains quite a few banks, utilities, and industrial companies. The list does not include any Master Limited Partnerships (MLPs). But it does include five Real Estate Investment Trusts (REITs). Note that there were seven REITs at the start of the year but Urstadt-Biddle Properties (UBA) and Tanger Factory Outlets (SKT) cut their dividends due to the impact of the coronavirus pandemic. I have written more detailed articles on these cuts at:
The largest Dividend Champion is Johnson & Johnson (JNJ) and the smallest Dividend Champion is Northeast Indiana Bancorp (NIDB). This is a very small bank with a market capitalization less than $50M and thus it is not that liquid. Investors should consider the risks before investing in microcap stocks. There are several other small banks and thrifts with markets caps ranging from $100M to $200M on the list. Again, investors should be aware of the risks of stocks with small market capitalizations.
The average rate of dividend increases over the past decade is a decent 7.8%. The average payout ratio of all 139 companies is about 71%. This is higher than at the start of year. But the rise is mostly due to depressed earnings during the pandemic. The mean yield for all 139 Dividend Champions is ~2.9% as of this writing.
The Dividend Champions 2020 list serves as a screen for further investigating as stock for a dividend growth portfolio. It is a list of companies with stable business that have competitive advantages and have returned cash to shareowners consistently through dividends and in some cases buybacks.
List of Dividend Champions – Updated 12/07/20
| Company Name | Ticker | No. Years | Dividend Yield (%) | Payout Rati (%) | 10-Year Dividend Growth Rate (%) | TTM P/E Ratio | Market Cap (millions) |
|---|---|---|---|---|---|---|---|
| American States Water | AWR | 66 | 1.82 | 60.09 | 8.7 | 33.10 | $ 2,800 |
| Dover Corp. | DOV | 65 | 1.62 | 43.14 | 8.6 | 26.59 | $ 17,890 |
| Northwest Natural Gas | NWN | 65 | 4.01 | 93.20 | 1.7 | 23.26 | $ 1,550 |
| Emerson Electric | EMR | 64 | 2.63 | 62.15 | 4.0 | 23.64 | $ 46,800 |
| Genuine Parts Co. | GPC | 64 | 3.21 | n/a | 6.6 | n/a | $ 14,280 |
| Procter & Gamble Co. | PG | 64 | 2.28 | 60.47 | 5.6 | 26.55 | $ 342,460 |
| Parker-Hannifin Corp. | PH | 63 | 1.32 | 38.47 | 13.0 | 29.21 | $ 35,300 |
| 3M Company | MMM | 62 | 3.40 | 68.93 | 10.9 | 20.25 | $ 102,170 |
| Cincinnati Financial | CINF | 60 | 3.14 | 49.48 | 3.5 | 15.74 | $ 12,640 |
| Farmers & Merchants Bancorp | FMCB | 58 | 2.06 | n/a | 2.7 | n/a | n/a |
| Johnson & Johnson | JNJ | 58 | 2.79 | 64.64 | 6.9 | 23.15 | $ 378,240 |
| Coca-Cola Company | KO | 58 | 3.18 | 84.97 | 6.9 | 26.74 | $ 227,460 |
| Lancaster Colony Corp. | LANC | 58 | 1.77 | 61.98 | 8.7 | 34.99 | $ 4,720 |
| Lowe’s Companies | LOW | 58 | 1.54 | 33.90 | 19.4 | 22.01 | $ 113,480 |
| Colgate-Palmolive Co. | CL | 57 | 2.06 | 56.23 | 7.1 | 27.36 | $ 72,640 |
| Nordson Corp. | NDSN | 57 | 0.77 | 27.27 | 14.5 | 35.63 | $ 11,750 |
| Hormel Foods Corp. | HRL | 54 | 2.08 | 59.04 | 16.0 | 28.42 | $ 25,290 |
| ABM Industries Inc. | ABM | 53 | 1.92 | n/a | 3.3 | n/a | $ 2,680 |
| California Water Service | CWT | 53 | 1.72 | n/a | 3.0 | n/a | $ 2,540 |
| Federal Realty Inv. Trust | FRT | 53 | 4.86 | 181.97 | 4.6 | 37.43 | $ 6,890 |
| Stepan Company | SCL | 53 | 1.05 | 23.92 | 8.6 | 22.78 | $ 2,660 |
| SJW Corp. | SJW | 53 | 1.95 | 86.49 | 6.2 | 44.32 | $ 1,920 |
| Stanley Black & Decker | SWK | 53 | 1.52 | 45.38 | 7.6 | 29.87 | $ 29,870 |
| Target Corp. | TGT | 53 | 1.52 | 36.03 | 14.7 | 23.78 | $ 90,050 |
| Commerce Bancshares | CBSH | 52 | 1.64 | 38.30 | 6.4 | 23.39 | $ 7,700 |
| Tootsie Roll Industries | TR | 52 | 1.16 | 40.91 | 4.5 | 35.19 | $ 2,020 |
| H.B. Fuller Company | FUL | 51 | 1.24 | 29.55 | 8.9 | 23.79 | $ 2,770 |
| Altria Group Inc. | MO | 51 | 8.64 | 731.91 | 9.7 | 84.74 | $ 75,040 |
| Black Hills Corp. | BKH | 50 | 3.72 | 63.66 | 3.7 | 17.14 | $ 4,050 |
| National Fuel Gas | NFG | 50 | 4.32 | n/a | 2.7 | n/a | $ 3,870 |
| Sysco Corp. | SYY | 50 | 2.52 | n/a | 5.0 | n/a | $ 36,510 |
| Becton Dickinson & Co. | BDX | 49 | 1.41 | 121.61 | 8.9 | 86.02 | $ 65,970 |
| Computer Services Inc. | CSVI | 49 | 1.72 | 49.75 | 15.8 | 28.91 | $ 1,610 |
| W.W. Grainger Inc. | GWW | 49 | 1.46 | 52.31 | 12.3 | 35.75 | $ 22,250 |
| MSA Safety Inc. | MSA | 49 | 1.15 | 48.73 | 5.5 | 42.33 | $ 5,870 |
| PPG Industries Inc. | PPG | 49 | 1.47 | 47.58 | 6.4 | 32.33 | $ 34,650 |
| Tennant Company | TNC | 49 | 1.37 | 40.53 | 5.2 | 29.59 | $ 1,290 |
| Universal Corp. | UVV | 49 | 6.77 | 136.28 | 5.1 | 20.14 | $ 1,160 |
| Gorman-Rupp Company | GRC | 48 | 1.88 | 60.78 | 7.8 | 32.25 | $ 899 |
| Kimberly-Clark Corp. | KMB | 48 | 3.07 | 62.21 | 6.0 | 20.25 | $ 47,860 |
| Leggett & Platt Inc. | LEG | 48 | 3.71 | 94.12 | 4.4 | 25.35 | $ 5,940 |
| Middlesex Water Co. | MSEX | 48 | 1.59 | 50.00 | 3.2 | 31.42 | $ 1,240 |
| PepsiCo Inc. | PEP | 48 | 2.84 | 80.83 | 8.0 | 28.50 | $ 199,220 |
| VF Corp. | VFC | 48 | 2.35 | n/a | 13.0 | n/a | $ 34,150 |
| Nucor Corp. | NUE | 47 | 3.00 | 114.18 | 1.3 | 38.09 | $ 16,540 |
| RPM International Inc. | RPM | 47 | 1.73 | 52.41 | 5.8 | 30.35 | $ 11,310 |
| S&P Global Inc. | SPGI | 47 | 0.76 | 26.83 | 9.7 | 35.21 | $ 81,330 |
| Wal-Mart Inc. | WMT | 47 | 1.41 | 31.17 | 7.2 | 22.05 | $ 430,250 |
| Consolidated Edison | ED | 46 | 4.01 | 75.74 | 2.3 | 18.87 | $ 26,340 |
| Illinois Tool Works | ITW | 46 | 2.16 | 69.20 | 12.6 | 32.03 | $ 66,820 |
| Telephone & Data Sys. | TDS | 46 | 3.58 | 35.23 | 4.4 | 9.83 | $ 2,090 |
| Archer Daniels Midland | ADM | 45 | 2.89 | 49.66 | 9.6 | 17.16 | $ 28,100 |
| Automatic Data Proc. | ADP | 45 | 2.14 | 64.70 | 10.6 | 30.24 | $ 74,650 |
| McDonald’s Corp. | MCD | 45 | 2.37 | 78.78 | 8.7 | 33.20 | $ 163,430 |
| MGE Energy Inc. | MGEE | 45 | 2.16 | 56.06 | 3.6 | 26.01 | $ 2,610 |
| RLI Corp. | RLI | 45 | 1.00 | 34.53 | 5.6 | 34.44 | $ 4,570 |
| United Bankshares Inc. | UBSI | 45 | 4.78 | 61.95 | 1.6 | 12.96 | $ 3,970 |
| Walgreens Boots Alliance Inc. | WBA | 45 | 4.92 | 381.63 | 13.6 | 77.57 | $ 33,830 |
| Carlisle Companies | CSL | 44 | 1.45 | 34.09 | 11.1 | 23.51 | $ 7,960 |
| Pentair Ltd. | PNR | 44 | 1.47 | 35.51 | 4.6 | 24.21 | $ 8,680 |
| Clorox Company | CLX | 43 | 2.19 | 49.44 | 7.7 | 22.60 | $ 25,310 |
| Medtronic plc | MDT | 43 | 2.04 | 89.58 | 10.2 | 43.90 | $ 152,460 |
| Sherwin-Williams Co. | SHW | 42 | 0.72 | 26.44 | 12.3 | 36.88 | $ 66,410 |
| Franklin Resources | BEN | 40 | 4.91 | 67.92 | 14.0 | 13.83 | $ 11,260 |
| Community Trust Banc. | CTBI | 40 | 4.55 | 45.83 | 3.1 | 10.07 | $ 632 |
| AFLAC Inc. | AFL | 39 | 3.00 | 20.63 | 6.8 | 6.86 | $ 32,040 |
| Eaton Vance Corp. | EV | 39 | 2.24 | 123.97 | 8.6 | 55.36 | $ 7,860 |
| Old Republic International | ORI | 39 | 4.69 | 79.25 | 1.6 | 16.91 | $ 5,680 |
| Air Products & Chem. | APD | 38 | 1.91 | 62.69 | 9.9 | 32.76 | $ 61,470 |
| Cintas Corp. | CTAS | 38 | 0.79 | 32.71 | 18.4 | 41.51 | $ 37,720 |
| Weyco Group Inc. | WEYS | 38 | 5.36 | n/a | 4.9 | n/a | $ 182 |
| Atmos Energy | ATO | 37 | 2.61 | 51.12 | 5.0 | 19.61 | $ 12,510 |
| Brown-Forman Class B | BF-B | 37 | 0.89 | 35.72 | 8.0 | 40.13 | $ 37,570 |
| Sonoco Products Co. | SON | 37 | 2.96 | 65.90 | 4.6 | 22.25 | $ 5,910 |
| ExxonMobil Corp. | XOM | 37 | 9.13 | 580.00 | 7.5 | 63.55 | $ 172,550 |
| AT&T Inc. | T | 36 | 7.23 | 136.84 | 2.2 | 18.91 | $ 206,580 |
| Brady Corp. | BRC | 35 | 1.99 | 43.35 | 2.2 | 21.76 | $ 2,370 |
| NACCO Industries | NC | 35 | 2.88 | 20.37 | 13.5 | 7.08 | $ 190 |
| Universal Health Realty Trust | UHT | 35 | 4.57 | 187.76 | 1.3 | 41.11 | $ 882 |
| Mercury General Corp. | MCY | 34 | 5.69 | 58.43 | 0.8 | 10.27 | $ 2,560 |
| McCormick & Co. | MKC | 34 | 1.45 | 48.14 | 9.0 | 33.09 | $ 24,760 |
| Tompkins Financial Corp. | TMP | 34 | 3.40 | 43.20 | 5.0 | 12.72 | $ 1,020 |
| T. Rowe Price Group | TROW | 34 | 2.51 | 40.31 | 11.8 | 16.06 | $ 32,840 |
| Chevron Corp. | CVX | 33 | 5.92 | n/a | 6.0 | n/a | $ 177,370 |
| Donaldson Company | DCI | 33 | 1.58 | 42.00 | 13.6 | 26.62 | $ 6,850 |
| Eagle Financial Services | EFSI | 33 | 3.73 | n/a | 3.9 | n/a | n/a |
| UGI Corp. | UGI | 33 | 3.72 | 52.17 | 8.1 | 14.02 | $ 7,840 |
| 1st Source Corp. | SRCE | 32 | 3.00 | 37.33 | 7.4 | 12.44 | $ 1,020 |
| First Financial Corp. | THFF | 32 | 2.80 | 27.75 | 1.4 | 9.91 | $ 529 |
| National Retail Properties | NNN | 31 | 5.52 | 167.74 | 3.1 | 30.40 | $ 6,920 |
| Calvin B. Taylor Bankshares Inc. | TYCB | 31 | 3.41 | n/a | 1.1 | n/a | n/a |
| Erie Indemnity Company | ERIE | 30 | 1.71 | 77.67 | 7.2 | 45.39 | $ 10,620 |
| Jack Henry & Associates | JKHY | 30 | 1.07 | 44.22 | 16.8 | 41.35 | $ 12,050 |
| Community Bank System | CBU | 29 | 2.70 | 55.81 | 5.8 | 20.68 | $ 3,520 |
| General Dynamics | GD | 29 | 2.95 | 39.93 | 10.4 | 13.55 | $ 43,630 |
| MDU Resources | MDU | 29 | 3.41 | 45.70 | 2.8 | 13.41 | $ 5,190 |
| SEI Investments Company | SEIC | 29 | 1.33 | 23.57 | 15.2 | 17.76 | $ 8,060 |
| UMB Financial Corp. | UMBF | 29 | 1.88 | 31.53 | 5.5 | 16.75 | $ 3,420 |
| Arrow Financial Corp. | AROW | 28 | 3.49 | 42.28 | 3.3 | 12.10 | $ 479 |
| Artesian Resources | ARTNA | 28 | 2.78 | 57.13 | 3.1 | 20.54 | $ 356 |
| Badger Meter Inc. | BMI | 28 | 0.87 | 43.37 | 10.8 | 49.66 | $ 2,380 |
| Chesapeake Financial Shares | CPKF | 28 | 2.38 | n/a | 7.2 | n/a | n/a |
| Enterprise Bancorp Inc. | EBTC | 28 | 2.70 | 27.45 | 5.4 | 10.15 | $ 315 |
| Ecolab Inc. | ECL | 28 | 0.85 | 49.74 | 12.6 | 58.77 | $ 62,240 |
| Franklin Electric Co. | FELE | 28 | 0.92 | 31.16 | 8.8 | 33.96 | $ 3,150 |
| McGrath Rentcorp | MGRC | 28 | 2.64 | 42.53 | 5.5 | 16.11 | $ 1,590 |
| People’s United Financial | PBCT | 28 | 5.81 | 62.61 | 1.5 | 10.78 | $ 5,610 |
| Roper Technologies Inc. | ROP | 28 | 0.53 | 15.16 | 18.8 | 28.77 | $ 43,890 |
| Westamerica Bancorp | WABC | 28 | 2.98 | 57.34 | 1.5 | 19.27 | $ 1,560 |
| West Pharmaceutical Services | WST | 28 | 0.25 | 16.50 | 7.2 | 66.79 | $ 19,900 |
| Essential Utilities Inc. | WTRG | 28 | 2.21 | 104.46 | 7.5 | 47.17 | $ 11,350 |
| A.O. Smith Corp. | AOS | 27 | 1.85 | 53.61 | 21.5 | 29.03 | $ 9,100 |
| BancFirst Corp. OK | BANF | 27 | 2.51 | 45.33 | 10.6 | 18.08 | $ 1,890 |
| Brown & Brown Inc. | BRO | 27 | 0.82 | 22.98 | 7.9 | 27.97 | $ 13,030 |
| Chubb Limited | CB | 27 | 2.11 | 62.03 | 9.9 | 29.39 | $ 68,850 |
| Cullen/Frost Bankers | CFR | 27 | 3.43 | 54.34 | 5.1 | 15.83 | $ 5,520 |
| John Wiley & Sons Inc. | JW-A | 27 | 3.97 | n/a | 9.5 | n/a | $ 2,310 |
| Linde Plc | LIN | 27 | 1.50 | 91.93 | 8.1 | 61.20 | $ 132,820 |
| Realty Income Corp. | O | 27 | 4.68 | 232.07 | 4.7 | 49.56 | $ 22,080 |
| PSB Holdings Inc. | PSBQ | 27 | 1.87 | n/a | 6.2 | n/a | n/a |
| Stryker Corp. | SYK | 27 | 0.99 | 49.78 | 15.3 | 50.52 | $ 87,830 |
| Thomson Reuters Corp. | TRI | 27 | 1.92 | 110.95 | 2.5 | 57.91 | $ 39,500 |
| Albemarle Corp. | ALB | 26 | 1.13 | 43.02 | 11.1 | 37.98 | $ 14,340 |
| AptarGroup Inc. | ATR | 26 | 1.14 | 45.71 | 9.0 | 40.10 | $ 8,170 |
| Caterpillar Inc. | CAT | 26 | 2.37 | 68.55 | 8.4 | 28.88 | $ 94,870 |
| Essex Property Trust | ESS | 26 | 3.38 | 91.02 | 6.5 | 26.93 | $ 16,590 |
| Expeditors International | EXPD | 26 | 1.16 | 28.03 | 10.2 | 24.09 | $ 15,290 |
| Lincoln Electric Holdings | LECO | 26 | 1.77 | 60.53 | 13.3 | 34.12 | $ 6,790 |
| Matthews International | MATW | 26 | 3.22 | n/a | 11.8 | n/a | $ 925 |
| NextEra Energy Inc. | NEE | 26 | 1.90 | 70.35 | 10.2 | 36.98 | $ 148,830 |
| Northeast Indiana Bancorp | NIDB | 26 | 2.87 | n/a | 4.4 | n/a | n/a |
| Southside Bancshares | SBSI | 26 | 4.35 | 60.95 | 12.6 | 14.00 | $ 1,010 |
| Canadian National Railway | CNI | 25 | 1.63 | 49.43 | 13.8 | 30.41 | $ 77,760 |
| First of Long Island Corp. | FLIC | 25 | 4.52 | 45.78 | 7.7 | 10.13 | $ 428 |
| International Business Machines | IBM | 25 | 5.28 | 72.77 | 11.6 | 13.79 | $ 110,670 |
| New Jersey Resources | NJR | 25 | 4.03 | 73.48 | 6.7 | 18.25 | $ 3,590 |
| Polaris Industries | PII | 25 | 2.58 | 751.52 | 12.1 | n/a | $ 5,900 |
| RenaissanceRe Holdings | RNR | 25 | 0.85 | 12.32 | 3.5 | 14.49 | $ 8,710 |
| Mean | 40.0 | 2.7 | 77.8 | 7.8 | 29.0 | $ 40,152 | |
| Median | 38.0 | 2.3 | 52.2 | 7.2 | 26.7 | $ 10,940 |
Dividend Calendar for the Dividend Champions 2020
| Company | Ticker | Ex-Dividend Date | Dividend Record Date | Dividend Payment Date | Next Dividend Payment Per Share | Annual Dividend Per Share |
|---|---|---|---|---|---|---|
| ABM Indus | ABM | 9/30/20 | 10/1/20 | 11/2/20 | $0.19 | $0.74 |
| Archer-Daniels Midland | ADM | 11/18/20 | 11/19/20 | 12/10/20 | $0.36 | $1.44 |
| Automatic Data Processing | ADP | 12/10/20 | 12/11/20 | 1/1/21 | $0.93 | $3.72 |
| Aflac | AFL | 2/16/21 | 2/17/21 | 3/1/21 | $0.33 | $1.32 |
| Albemarle | ALB | 12/10/20 | 12/11/20 | 1/4/21 | $0.38 | $1.54 |
| A.O. Smith | AOS | 10/29/20 | 10/30/20 | 11/16/20 | $0.26 | $1.04 |
| Air Products & Chemicals | APD | 12/31/20 | 1/4/21 | 2/8/21 | $1.34 | $5.36 |
| Arrow Financial | AROW | 12/1/20 | 12/2/20 | 12/15/20 | $0.26 | $1.04 |
| Artesian Resources | ARTNA | 11/6/20 | 11/9/20 | 11/20/20 | $0.26 | $1.03 |
| Atmos Energy | ATO | 11/27/20 | 11/30/20 | 12/14/20 | $0.62 | $2.50 |
| AptarGroup | ATR | 10/27/20 | 10/28/20 | 11/18/20 | $0.36 | $1.44 |
| American States Water | AWR | 11/13/20 | 11/16/20 | 12/1/20 | $0.34 | $1.34 |
| BancFirst | BANF | 12/30/20 | 12/31/20 | 1/15/21 | $0.34 | $1.36 |
| Becton, Dickinson | BDX | 12/9/20 | 12/10/20 | 12/31/20 | $0.83 | $3.32 |
| Franklin Resources | BEN | 9/29/20 | 9/30/20 | 10/15/20 | $0.27 | $1.08 |
| Brown-Forman | BF.B | 12/3/20 | 12/4/20 | 1/4/21 | $0.18 | $0.72 |
| Black Hills | BKH | 11/16/20 | 11/17/20 | 12/1/20 | $0.56 | $2.26 |
| Badger Meter | BMI | 11/25/20 | 11/27/20 | 12/11/20 | $0.18 | $0.72 |
| Brady | BRC | 1/7/21 | 1/8/21 | 1/29/21 | $0.22 | $0.88 |
| Brown & Brown | BRO | 11/3/20 | 11/4/20 | 11/18/20 | $0.09 | $0.37 |
| Caterpillar | CAT | 10/23/20 | 10/26/20 | 11/20/20 | $1.03 | $4.12 |
| Chubb | CB | 12/17/20 | 12/18/20 | 1/8/21 | $0.78 | $3.12 |
| Commerce Bancshares | CBSH | 12/1/20 | 12/2/20 | 12/18/20 | $0.27 | $1.08 |
| Community Bank System | CBU | 12/11/20 | 12/14/20 | 1/11/21 | $0.42 | $1.68 |
| Cullen/Frost Bankers | CFR | 11/27/20 | 11/30/20 | 12/15/20 | $0.72 | $2.88 |
| Cincinnati Financial | CINF | 12/15/20 | 12/16/20 | 1/15/21 | $0.60 | $2.40 |
| Colgate-Palmolive | CL | 10/22/20 | 10/23/20 | 11/16/20 | $0.44 | $1.76 |
| Clorox | CLX | 1/26/21 | 1/27/21 | 2/12/21 | $1.11 | $4.44 |
| Canadian National Railway | CNI | 12/8/20 | 12/9/20 | 12/30/20 | $0.44 | $1.74 |
| Chesapeake Financial | CPKF | 11/30/20 | 12/1/20 | 12/15/20 | $0.12 | $0.50 |
| Carlisle Companies | CSL | 11/16/20 | 11/17/20 | 12/1/20 | $0.52 | $2.10 |
| Computer Services | CSVI | 11/30/20 | 12/1/20 | 12/28/20 | $0.25 | $1.00 |
| Cintas | CTAS | 11/5/20 | 11/6/20 | 12/4/20 | $0.70 | $2.80 |
| Community Trust Bancorp | CTBI | 12/14/20 | 12/15/20 | 1/1/21 | $0.38 | $1.54 |
| Chevron | CVX | 11/17/20 | 11/18/20 | 12/10/20 | $1.29 | $5.16 |
| California Water Service | CWT | 11/6/20 | 11/9/20 | 11/20/20 | $0.21 | $0.85 |
| Donaldson | DCI | 12/4/20 | 12/7/20 | 12/22/20 | $0.21 | $0.84 |
| Dover | DOV | 11/27/20 | 11/30/20 | 12/14/20 | $0.50 | $1.98 |
| Enterprise Bancorp | EBTC | 11/9/20 | 11/10/20 | 12/1/20 | $0.17 | $0.70 |
| Ecolab | ECL | 12/14/20 | 12/15/20 | 1/15/21 | $0.48 | $1.92 |
| Consolidated Edison | ED | 11/17/20 | 11/18/20 | 12/15/20 | $0.76 | $3.06 |
| Eagle Financial Services | EFSI | 10/30/20 | 11/2/20 | 11/16/20 | $0.26 | $1.04 |
| Emerson Electric | EMR | 11/12/20 | 11/13/20 | 12/10/20 | $0.50 | $2.02 |
| Erie Indemnity | ERIE | 10/2/20 | 10/5/20 | 10/20/20 | $0.96 | $3.86 |
| Essex Property Trust | ESS | 9/29/20 | 9/30/20 | 10/15/20 | $2.08 | $8.31 |
| Eaton Vance | EV | 12/3/20 | 12/4/20 | 12/18/20 | $4.25 | $1.50 |
| Expeditors International | EXPD | 11/30/20 | 12/1/20 | 12/15/20 | $0.52 | $1.04 |
| Franklin Electric | FELE | 11/4/20 | 11/5/20 | 11/19/20 | $0.16 | $0.62 |
| First of Long Island | FLIC | 10/9/20 | 10/13/20 | 10/22/20 | $0.19 | $0.76 |
| Farmers & Merchants | FMCB | 12/8/20 | 12/9/20 | 1/2/21 | $7.50 | $15.00 |
| Federal Realty Investment | FRT | 12/31/20 | 1/4/21 | 1/15/21 | $1.06 | $4.24 |
| H.B. Fuller | FUL | 10/14/20 | 10/15/20 | 10/29/20 | $0.16 | $0.65 |
| General Dynamics | GD | 1/14/21 | 1/15/21 | 2/5/21 | $1.10 | $4.40 |
| Genuine Parts | GPC | 12/3/20 | 12/4/20 | 1/4/21 | $0.79 | $3.16 |
| Gorman-Rupp | GRC | 11/12/20 | 11/13/20 | 12/10/20 | $0.16 | $0.62 |
| W.W. Grainger | GWW | 11/6/20 | 11/9/20 | 12/1/20 | $1.53 | $6.12 |
| Hormel Foods | HRL | 1/8/21 | 1/11/21 | 2/16/21 | $0.25 | $0.98 |
| IBM | IBM | 11/9/20 | 11/10/20 | 12/10/20 | $1.63 | $6.52 |
| Illinois Tool Works | ITW | 12/30/20 | 12/31/20 | 1/14/21 | $1.14 | $4.56 |
| Jack Henry & Associates | JKHY | 12/1/20 | 12/2/20 | 12/22/20 | $0.43 | $1.72 |
| Johnson & Johnson | JNJ | 11/23/20 | 11/24/20 | 12/8/20 | $1.01 | $4.04 |
| John Wiley & Sons | JW.A | 10/5/20 | 10/6/20 | 10/21/20 | $0.34 | $1.37 |
| Kimberly-Clark | KMB | 12/3/20 | 12/4/20 | 1/5/21 | $1.07 | $4.28 |
| Coca-Cola | KO | 11/30/20 | 12/1/20 | 12/15/20 | $0.41 | $1.64 |
| Lancaster Colony | LANC | 12/4/20 | 12/7/20 | 12/31/20 | $0.75 | $3.00 |
| Lincoln Electric Holdings | LECO | 12/30/20 | 12/31/20 | 1/15/21 | $0.51 | $2.04 |
| Leggett & Platt | LEG | 12/14/20 | 12/15/20 | 1/15/21 | $0.40 | $1.60 |
| Linde | LIN | 12/2/20 | 12/3/20 | 12/17/20 | $0.96 | $3.85 |
| Lowe’s Companies | LOW | 1/19/21 | 1/20/21 | 2/3/21 | $0.60 | $2.40 |
| Matthews International | MATW | 11/27/20 | 11/30/20 | 12/14/20 | $0.22 | $0.86 |
| McDonald’s | MCD | 11/30/20 | 12/1/20 | 12/15/20 | $1.29 | $5.16 |
| Mercury General | MCY | 12/15/20 | 12/16/20 | 12/30/20 | $0.63 | $2.53 |
| Medtronic | MDT | 9/24/20 | 9/25/20 | 10/16/20 | $0.58 | $2.32 |
| MDU Resources Gr | MDU | 12/9/20 | 12/10/20 | 1/1/21 | $0.21 | $0.85 |
| MGE Energy | MGEE | 11/30/20 | 12/1/20 | 12/15/20 | $0.37 | $1.48 |
| McGrath RentCorp | MGRC | 10/15/20 | 10/16/20 | 10/30/20 | $0.42 | $1.68 |
| McCormick & Co | MKC | 12/30/20 | 12/31/20 | 1/11/21 | $0.34 | $1.36 |
| 3M | MMM | 11/19/20 | 11/20/20 | 12/12/20 | $1.47 | $5.88 |
| Altria Group | MO | 9/14/20 | 9/15/20 | 10/9/20 | $0.86 | $3.44 |
| MSA Safety | MSA | 11/10/20 | 11/12/20 | 12/10/20 | $0.43 | $1.72 |
| Middlesex Water | MSEX | 11/12/20 | 11/13/20 | 12/1/20 | $0.27 | $1.04 |
| NACCO Industries | NC | 11/27/20 | 11/30/20 | 12/15/20 | $0.19 | $0.77 |
| Nordson | NDSN | 8/24/20 | 8/25/20 | 9/8/20 | $0.39 | $1.56 |
| NextEra Energy | NEE | 11/25/20 | 11/27/20 | 12/15/20 | $0.35 | $1.40 |
| National Fuel Gas | NFG | 9/29/20 | 9/30/20 | 10/15/20 | $0.44 | $1.78 |
| Northeast Indiana Bancorp | NIDB | 12/8/20 | 12/9/20 | 12/23/20 | $2.00 | $1.12 |
| New Jersey Resources | NJR | 12/15/20 | 12/16/20 | 1/4/21 | $0.33 | $1.33 |
| National Retail Props | NNN | 10/29/20 | 10/30/20 | 11/16/20 | $0.52 | $2.08 |
| Nucor | NUE | 12/30/20 | 12/31/20 | 2/11/21 | $0.41 | $1.62 |
| Northwest Natural Hldg | NWN | 10/29/20 | 10/30/20 | 11/13/20 | $0.48 | $1.92 |
| Realty Income | O | 11/30/20 | 12/1/20 | 12/15/20 | $0.23 | $2.81 |
| Old Republic Intl | ORI | 12/3/20 | 12/4/20 | 12/15/20 | $0.21 | $0.84 |
| People’s United Finl | PBCT | 10/30/20 | 11/2/20 | 11/15/20 | $0.18 | $0.72 |
| PepsiCo | PEP | 12/3/20 | 12/4/20 | 1/7/21 | $1.02 | $4.09 |
| Procter & Gamble | PG | 10/22/20 | 10/23/20 | 11/16/20 | $0.79 | $3.16 |
| Parker Hannifin | PH | 11/5/20 | 11/6/20 | 12/4/20 | $0.88 | $3.52 |
| Polaris | PII | 11/30/20 | 12/1/20 | 12/15/20 | $0.62 | $2.48 |
| Pentair | PNR | 10/22/20 | 10/23/20 | 11/6/20 | $0.19 | $0.76 |
| PPG Industries | PPG | 11/9/20 | 11/10/20 | 12/11/20 | $0.54 | $2.16 |
| PSB Holdings | PSBQ | 7/9/20 | 7/10/20 | 7/31/20 | $0.21 | $0.42 |
| RLI | RLI | 11/27/20 | 11/30/20 | 12/18/20 | $0.24 | $0.96 |
| RenaissanceRe Holdings | RNR | 12/14/20 | 12/15/20 | 12/31/20 | $0.35 | $1.40 |
| Roper Technologies | ROP | 1/7/21 | 1/8/21 | 1/22/21 | $0.56 | $2.25 |
| RPM International | RPM | 10/16/20 | 10/19/20 | 10/30/20 | $0.38 | $1.52 |
| Southside Bancshares | SBSI | 11/24/20 | 11/25/20 | 12/10/20 | $0.32 | $1.28 |
| Stepan | SCL | 11/27/20 | 11/30/20 | 12/15/20 | $0.31 | $1.22 |
| SEI Investments | SEIC | 6/12/20 | 6/15/20 | 6/23/20 | $0.35 | $0.70 |
| Sherwin-Williams | SHW | 11/12/20 | 11/13/20 | 12/4/20 | $1.34 | $5.36 |
| SJW Gr | SJW | 11/6/20 | 11/9/20 | 12/1/20 | $0.32 | $1.28 |
| Sonoco Products | SON | 11/9/20 | 11/10/20 | 12/10/20 | $0.43 | $1.72 |
| S&P Global | SPGI | 11/24/20 | 11/25/20 | 12/10/20 | $0.67 | $2.68 |
| 1st Source | SRCE | 11/2/20 | 11/3/20 | 11/13/20 | $0.28 | $1.12 |
| Stanley Black & Decker | SWK | 11/30/20 | 12/1/20 | 12/15/20 | $0.70 | $2.80 |
| Stryker | SYK | 12/30/20 | 12/31/20 | 1/29/21 | $0.63 | $2.52 |
| Sysco | SYY | 1/7/21 | 1/8/21 | 1/29/21 | $0.45 | $1.80 |
| AT&T | T | 10/8/20 | 10/12/20 | 11/2/20 | $0.52 | $2.08 |
| Telephone and Data | TDS | 12/15/20 | 12/16/20 | 12/30/20 | $0.17 | $0.68 |
| Target | TGT | 11/17/20 | 11/18/20 | 12/10/20 | $0.68 | $2.72 |
| First Financial | THFF | 1/7/21 | 1/8/21 | 1/15/21 | $0.53 | $1.06 |
| Tompkins Financial | TMP | 11/2/20 | 11/3/20 | 11/13/20 | $0.54 | $2.16 |
| Tennant | TNC | 11/27/20 | 11/30/20 | 12/15/20 | $0.23 | $0.92 |
| Tootsie Roll Industries | TR | 6/12/20 | 6/15/20 | 7/6/20 | $0.09 | $0.36 |
| Thomson Reuters | TRI | 11/18/20 | 11/19/20 | 12/15/20 | $0.38 | $1.52 |
| T. Rowe Price Group | TROW | 12/14/20 | 12/15/20 | 12/30/20 | $0.90 | $3.60 |
| Calvin B. Taylor | TYCB | 9/29/20 | 9/30/20 | 10/15/20 | $0.29 | $1.16 |
| United Bankshares | UBSI | 12/10/20 | 12/11/20 | 1/4/21 | $0.35 | $1.40 |
| UGI | UGI | 12/14/20 | 12/15/20 | 1/1/21 | $0.33 | $1.32 |
| Universal Health Realty | UHT | 12/16/20 | 12/17/20 | 12/31/20 | $0.69 | $2.78 |
| UMB Financial | UMBF | 12/9/20 | 12/10/20 | 1/4/21 | $0.32 | $1.28 |
| Universal | UVV | 1/8/21 | 1/11/21 | 2/1/21 | $0.77 | $3.08 |
| VF | VFC | 12/9/20 | 12/10/20 | 12/21/20 | $0.49 | $1.96 |
| Westamerica Banc | WABC | 10/30/20 | 11/2/20 | 11/13/20 | $0.41 | $1.64 |
| Walgreens Boots Alliance | WBA | 11/18/20 | 11/19/20 | 12/11/20 | $0.47 | $1.87 |
| Weyco Group | WEYS | 11/27/20 | 11/30/20 | 1/4/21 | $0.24 | $0.96 |
| Walmart | WMT | 12/10/20 | 12/11/20 | 1/4/21 | $0.54 | $2.16 |
| West Pharmaceutical Servs | WST | 11/9/20 | 11/11/20 | 11/18/20 | $0.17 | $0.65 |
| Essential Utilities | WTRG | 11/12/20 | 11/13/20 | 12/1/20 | $0.25 | $1.00 |
| Exxon Mobil | XOM | 11/10/20 | 11/12/20 | 12/10/20 | $0.87 | $3.48 |
Prior Year Lists and Articles
Here are my recommendations:
Affiliates
- Simply Investing Report & Analysis Platform or the Course can teach you how to invest in stocks. Try it free for 14 days.
- Free Dividend Kings Spreadsheet from Sure Dividend, complete with Buy/Hold/Sell recommendations, dividend histories, and much more. It is an excellent resource for DIY dividend growth investors and retirees.
- Stock Rover is the leading investment research platform with all the fundamental metrics, screens, and analysis tools you need. Try it free for 14 days.
Receive a free e-book, “Become a Better Investor: 5 Fundamental Metrics to Know!” Join thousands of other readers !
*This post contains affiliate links meaning that I earn a commission for any purchases that you make at the Affiliates website through these links. This will not incur additional costs for you. Please read my disclosure for more information.
Prakash Kolli is the founder of the Dividend Power site. He is a self-taught investor, analyst, and writer on dividend growth stocks and financial independence. His writings can be found on Seeking Alpha, InvestorPlace, Business Insider, Nasdaq, TalkMarkets, ValueWalk, The Money Show, Forbes, Yahoo Finance, and leading financial sites. In addition, he is part of the Portfolio Insight and Sure Dividend teams. He was recently in the top 1.0% and 100 (73 out of over 13,450) financial bloggers, as tracked by TipRanks (an independent analyst tracking site) for his articles on Seeking Alpha.
I cant figure out your list system!!??? It’s NOT alphabetical, NOT listed in descending or ascending order by yield, dividend, payout ratio, etc etc. Random??? If so, NOT efficient for a financial site. (And it would be nice to be able to sort all columns). thanks, steve
ps this applies to all your lists.
The lists are sorted by number of years of paying dividend. I am working on making it sortable by other columns as well for the next update. Another option that I may try is have a downloadable spreadsheet.