
In this article I provide an updated list of the Dividend Kings in 2020 along with select financial data and analysis. The Dividend Kings in 2020 are U.S. stocks that that have grown their dividend for 50+ years in a row. This is a fairly select list as only 31 companies have successfully done so as of November 30, 2020. This is out of the approximately 4,300 companies listed on stock exchanges at end of 2018. I update this list monthly.
These companies have survived periods of inflation, stock market crashes, global crisis and deep recessions. They may not have grown revenue and earnings per share every year, but they annually raised the dividend without fail. This length of time points to the durability of their businesses and sustainability of their dividends. This is extremely important for investors seeking produce income for retirement or build wealth. As of this writing, no Dividend King has cut or suspended its dividend yet due to the coronavirus pandemic. If you are interested in the list of stocks that have cut or suspended their dividend due to COVID-19 take a look at my article on Coronavirus Dividend Cuts and Suspensions. I update this list weekly.
Affiliate
Take the Simply Investing Course to learn more about investing and dividends.
- Lifetime access with 27 self-paced lessons.
- Covers placing stock orders, building and tracking portfolios, when to sell, reducing fees and risk, etc.
- Learn the 12 Rule of Simply Investing
- Simply Investing Coupon Code – DIVPOWER15.
Performance Update for the Dividend Kings 2020
The Dividend Kings are currently (as of November 30, 2020) trading at an elevated valuation of a trailing average price-to-earnings ratio of about 29.6X. This is up over two notches since last month. The current average dividend yield is about 2.5%, which is down since last month. The trailing average 10-year dividend growth rate is about 7.5%. The average payout ratio is approximately 85.7%. The average market cap is currently $55,945 million. Currently, the Dividend King with the highest yield is Altria Group (MO), and the one trading with the lowest earnings multiple is Cincinnati Financial (CINF). You can take a look at updated select financial data for each stock in the Dividend Kings list in the table at end of the article.
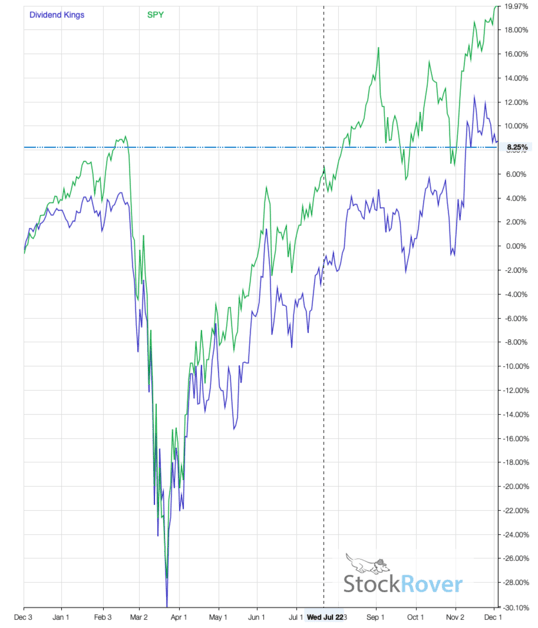
In the trailing 1-year the Dividend Kings as a group have returned +8.7% as a group compared to +19.9% for the S&P 500 (as measured by SPY), as seen in the chart below. I used Stock Rover* for this chart. Over the trailing 5-years the Dividend Kings have returned +44.2% and the S&P 500 has returned +94.0%.
Additions to the Dividend Kings in 2019
There were two new entries to the Dividend Kings list in 2019: Altria Group Inc (MO) and H.B. Fuller Company (FUL). Altria is a cigarette manufacturer with a market leading position. The company has many well known brands including Marlboro, Skoal, and Copenhagen. Altria also owns wine brand and has a stake in JUUL. H.B. Fuller is a chemical company that produces adhesives and sealants. It’s most well-known brands is probably Gorilla Glue.
Deletions to the Dividend Kings in 2019
Connecticut Water Service (CTWS) was acquired by SJW Corp (SJW) in 2019 and was removed from the list. The other company that left the Dividend Kings list in 2019 was Vectren Corp (VVC), due to an acquisition. Vectren Corp (VVC) was acquired by CenterPoint Energy Inc (CNP).
Other Dividend Stock Lists
I have also written articles with several other lists and analyses on U.S. dividend growth stocks including:
- List of Dividend Aristocrats in 2020
- List of Dividend Champions in 2020
- List of Dividend Contenders in 2020
- List of Dividend Challengers in 2020
- Dogs of the Dow in 2020
For Canadian stocks, I have written about
For UK stocks, I have written about
Some Details on the Dividend Kings in 2020
The company with the longest track record as a Dividend King is American States Water (AWR) with 66 years of straight increases. There were four water utilities on this list at the start of 2019. But Connecticut Water Service (CTWS) was acquired by SJW Corp (SJW) in 2019. This reduced the number to three. It is not surprising that water utilities have a high representation on this list. The provide an essential product for consumers and industries. The business does not grow fast but grows along with population growth over time. The market and dividend growth investors have largely recognized this by this point. The three remaining water utilities on the Dividend Kings list are trading at an earning multiple greater than the broader market for some time. For instance, American States Water trades at price-to-earnings ratios of over 30X.
There are currently no master limited partnerships (MLPs) on the list. There is only one real estate investment trust (REIT) on the list, Federal Realty Investment Trust (FRT). FRT is a shopping center REIT that operates in eight metropolitan areas.
Despite the length of time for dividend increases five companies have a 10-year double-digit rate of increase for the dividend. The median payout ratio is about 59% but there are a few companies that have high payout ratios over 65%. Currently, a few companies have payout ratios over 100%. This is not normal, but is due to depressed earnings resulting from COVID-19.
Interestingly, the list is not dominated by large cap companies but includes quite a few mid-cap companies ($2 billion – $10 billion) and small cap companies ($300 million – $2 billion). The largest company on the Dividend Kings list by market capitalization is Johnson & Johnson (JNJ) at about $361 billion. The smallest company on the Dividend Kings list by market capitalization is Farmers & Merchant Bancorp (FMCB) at about $570 million. Note that this stock is thinly traded and thus has more risks for small investors.
What I Like About the Dividend Kings?
The Dividend King list in 2020 serves as a screen for further investigating a stock for a dividend growth portfolio. It is a list of companies with stable business that have competitive advantages and have returned cash to shareholders consistently through dividends for an extended period of time. As a dividend growth investor this is a place to start for me.
Some investors ask “What’s the big deal about the Dividend Kings?” In my opinion it is a measure of success. I mean 31 Dividend Kings dividend by 4,300 companies is about 0.7%. So, very few companies can match this track record of dividend growth.
The Dividend Kings list changes only very slowly. Each year there are a few additions on average. However, the Dividend Kings list exhibits persistence. Once a company is on the list it tends to stay on the list. I believe that this is due to effort by each company’s management to maintain the dividend.
Sometimes companies are deleted from the Dividend Kings list due to mergers and acquisitions. For instance, Vectren and Connecticut Water Service were deleted from the list in 2019 since they were acquired.
However, there are some companies that do fall off the list for not raising the dividend or even worse cutting the dividend. In the past this has included Winn-Dixie (WINN), Ohio Casualty Corp (eventually acquired), Aon PLC (AON), Integrys Energy Group (TEG), Masco (MSA), and Diebold (DBD). I refer readers to an article on the Dividend Growth Investor blog on the evolution of the Dividend Kings list over the years. But in general most of these companies had several years in a row of operating difficulties or high leverage. Eventually, this led to a freeze in the dividend and subsequently a removal from the list.
Dividend Kings Historical Performance
On absolute terms the Dividend Kings have solid performance. The Dividend Kings have performed better than the S&P 500 with lower volatility over the past 20 years starting in 1999 through end of 2019. The 29 Dividend Kings during this time had a compound annual growth rate or CAGR of approximately 24.7% versus about 22.9% for the S&P 500. The internal rate of return or IRR is approximately 11.6% for the Dividend Kings and roughly 9.2% for the S&P 500.
There are three reasons for this. The Dividend Kings have less years with negative returns. During this time period the Dividend Kings had only two down years while the S&P 500 had four down years. Next, the worst down years for the S&P 500 was much worse than that of the Dividend Kings. the worst year for the Dividend Kings was only (17.62%) while the worst year for the S&P 500 was a whopping (36.81%) or more than double that of the Dividend Kings. The S&P 500 could not make this up on in the best year. Lastly, the Dividend outperformed the S&P 500 in 12 out of 20 years. You can check my article where I compare the Dividend Kings versus S&P 500 if you want more details.
The Dividend Kings also experienced lower volatility than the S&P 500 during the time period in question. The standard deviation of returns of was about 12.5% for the Dividend Kings versus roughly 14.4% for the S&P 500. The combination of higher rates of return and lower standard deviation results in a higher Sharpe ratio of 0.74 for the Dividend Kings versus 0.39 for the S&P 500 (based on monthly returns and 1-month U.S. Treasury bill). This indicates that the Dividend Kings have high risk-adjusted performance compared to the S&P 500.
Discrepancies in the Dividend Kings 2020
There are two discrepancies on the Dividend Kings 2020 list. One is Target (TGT) and the other is Illinois Tool Works (ITW) regarding the number of years that they have paid a growing dividend. There is a question of whether they are yet Dividend Kings or not. I have been counting them as Dividend Kings as have many others. But a few blog authors have not been counting them as Dividend kings. I have kept Target on the list. It seems like Illinois Tool Works is not a Dividend King so I have excluded it from the list.
Target has paid a growing annual dividend for at least 49 years according to its website. From 1970 – 1971 Target paid an annual cash dividend of $0.0104. In 1972, the company raised the dividend to $0.0108. So, based on this information Target has actually raised the annual dividend for 49 years. It would actually become a Dividend King next year assuming it raises the dividend. However, some lists and websites show Target raising the dividend for 53 years. I am not certain where these sites get the 53 years number. But Target initiated a dividend at end of 1967 so it has paid a dividend for 53 consecutive years. There was a 2:1 stock split in 1969 so that may be confusing the issue. However, at this point it is clear that Target is a Dividend Aristocrat and Dividend Champion, but not yet a Dividend King.
The other discrepancy is for Illinois Tool Works (ITW). The company has paid a growing dividend for at least 49 years. The company claims to have raised its dividend for 56 years. Some websites also show the 56 year value. However, the Drip Investing website shows that ITW has raised its dividend for 45 straight years. I refer to the excellent research by Dividend Growth Investor, who determined that ITW did not raise its dividend in 1971. The company acknowledges this in their 2019 ITW Annual Report where they state “ITW’s annual dividend payment has increased for more than 56 consecutive years, except during a period of government controls in 1971.” ITW did start increasing its dividend again in 1972. So, based on this ITW would be a Dividend King in 2021 assuming that it did raise the dividend next year. For now, ITW is a Dividend Aristocrat and Dividend Champion.
Who’s On Deck?
There are two Dividend Champions that have raised their dividend for 49 years. This includes Becton Dickinson & Co (BDX), MSA Safety (MSA), Computer Services (CVSI), W.W. Grainger (GWW), PPG Industries (PPG), Tennant Company (TNC), and Universal Corp (UVV). MSA Safety has already announced a dividend raise this year and their press releases states that they have raised the dividend for 50 straight years.
List of Dividend Kings in 2020 – Updated 12/04/20
| Company Name | Ticker | No. Years | Dividend Yield (%) | Payout Ratio (%) | 10-Yr Dividend Growth Rate (%) | TTM P/E Ratio | Market Cap (millions) |
|---|---|---|---|---|---|---|---|
| 3M Company | MMM | 62 | 3.40 | 68.93 | 10.94 | 20.25 | $ 35,300 |
| ABM Industries Inc. | ABM | 53 | 1.92 | n/a | 3.31 | n/a | $ 7,700 |
| Altria Group Inc. | MO | 50 | 8.64 | 731.91 | 9.70 | 84.74 | $ 4,050 |
| American States Water | AWR | 66 | 1.82 | 60.09 | 8.67 | 33.10 | $ 11,750 |
| Black Hills Corp. | BKH | 50 | 3.72 | 63.66 | 3.74 | 17.14 | $ 12,640 |
| California Water Service | CWT | 53 | 1.72 | n/a | 2.96 | n/a | $ 75,040 |
| Cincinnati Financial | CINF | 60 | 3.14 | 49.48 | 3.51 | 15.74 | $ 2,800 |
| Coca-Cola Company | KO | 58 | 3.18 | 84.97 | 6.91 | 26.74 | $ 6,890 |
| Colgate-Palmolive Co. | CL | 57 | 2.06 | 56.23 | 7.11 | 27.36 | $ 1,920 |
| Commerce Bancshares | CBSH | 52 | 1.64 | 38.30 | 6.36 | 23.39 | $ 14,280 |
| Dover Corp. | DOV | 65 | 1.62 | 43.14 | 8.58 | 26.59 | $ 2,540 |
| Emerson Electric | EMR | 64 | 2.63 | 62.15 | 4.05 | 23.64 | $ 2,660 |
| Farmers & Merchants Bancorp | FMCB | 58 | 2.06 | n/a | 2.68 | n/a | $ 36,510 |
| Federal Realty Inv. Trust | FRT | 53 | 4.86 | 181.97 | 4.65 | 37.43 | $ 2,020 |
| Genuine Parts Co. | GPC | 64 | 3.21 | n/a | 6.58 | n/a | $ 2,770 |
| H.B. Fuller Company | FUL | 51 | 1.24 | 29.55 | 8.93 | 23.79 | $ 342,460 |
| Hormel Foods Corp. | HRL | 54 | 2.08 | 59.04 | 16.03 | 28.42 | $ 1,550 |
| Johnson & Johnson | JNJ | 58 | 2.79 | 64.64 | 6.87 | 23.15 | $ 25,290 |
| Lancaster Colony Corp. | LANC | 58 | 1.77 | 61.98 | 8.66 | 34.99 | $ 72,640 |
| Lowe’s Companies | LOW | 58 | 1.54 | 33.90 | 19.39 | 22.01 | $ 227,460 |
| National Fuel Gas | NFG | 50 | 4.32 | n/a | 2.68 | n/a | $ 29,870 |
| Nordson Corp. | NDSN | 57 | 0.77 | 27.27 | 14.51 | 35.63 | $ 4,720 |
| Northwest Natural Gas | NWN | 65 | 4.01 | 93.20 | 1.75 | 23.26 | $ 113,480 |
| Parker-Hannifin Corp. | PH | 63 | 1.32 | 38.47 | 13.02 | 29.21 | n/a |
| Procter & Gamble Co. | PG | 64 | 2.28 | 60.47 | 5.56 | 26.55 | $ 102,170 |
| SJW Corp. | SJW | 53 | 1.95 | 86.49 | 6.16 | 44.32 | $ 90,050 |
| Stanley Black & Decker | SWK | 53 | 1.52 | 45.38 | 7.58 | 29.87 | $ 378,240 |
| Stepan Company | SCL | 53 | 1.05 | 23.92 | 8.58 | 22.78 | $ 17,890 |
| Sysco Corp. | SYY | 50 | 2.52 | n/a | 4.97 | n/a | $ 3,870 |
| Target Corp. | TGT | 53 | 1.52 | 36.03 | 14.69 | 23.78 | $ 46,800 |
| Tootsie Roll Industries | TR | 52 | 1.16 | 40.91 | 4.45 | 35.19 | $ 2,680 |
| Mean | 56.7 | 2.5 | 85.7 | 7.5 | 29.6 | $ 55,935 | |
| Median | 57 | 2.1 | 59.0 | 6.9 | 26.6 | $ 13,460 |
Dividend Calendar for the Dividend Kings 2020
| Company | Ticker | Ex-Dividend Date | Dividend Record Date | Dividend Payment Date | Next Dividend Payment Per Share | Annual Dividend Per Share |
|---|---|---|---|---|---|---|
| 3M | MMM | 11/19/20 | 11/20/20 | 12/12/20 | $1.47 | $5.88 |
| ABM Indus | ABM | 9/30/20 | 10/1/20 | 11/2/20 | $0.19 | $0.74 |
| Altria Group | MO | 9/14/20 | 9/15/20 | 10/9/20 | $0.86 | $3.44 |
| American States Water | AWR | 11/13/20 | 11/16/20 | 12/1/20 | $0.34 | $1.34 |
| Black Hills | BKH | 11/16/20 | 11/17/20 | 12/1/20 | $0.56 | $2.26 |
| California Water Service | CWT | 11/6/20 | 11/9/20 | 11/20/20 | $0.21 | $0.85 |
| Cincinnati Financial | CINF | 12/15/20 | 12/16/20 | 1/15/21 | $0.60 | $2.40 |
| Coca-Cola | KO | 11/30/20 | 12/1/20 | 12/15/20 | $0.41 | $1.64 |
| Colgate-Palmolive | CL | 10/22/20 | 10/23/20 | 11/16/20 | $0.44 | $1.76 |
| Commerce Bancshares | CBSH | 12/1/20 | 12/2/20 | 12/18/20 | $0.27 | $1.08 |
| Dover | DOV | 11/27/20 | 11/30/20 | 12/14/20 | $0.50 | $1.98 |
| Emerson Electric | EMR | 11/12/20 | 11/13/20 | 12/10/20 | $0.50 | $2.02 |
| Farmers & Merchants | FMCB | 12/8/20 | 12/9/20 | 1/2/21 | $7.50 | $15.00 |
| Federal Realty Investment | FRT | 12/31/20 | 1/4/21 | 1/15/21 | $1.06 | $4.24 |
| Genuine Parts | GPC | 12/3/20 | 12/4/20 | 1/4/21 | $0.79 | $3.16 |
| H.B. Fuller | FUL | 10/14/20 | 10/15/20 | 10/29/20 | $0.16 | $0.65 |
| Hormel Foods | HRL | 1/8/21 | 1/11/21 | 2/16/21 | $0.25 | $0.98 |
| Johnson & Johnson | JNJ | 11/23/20 | 11/24/20 | 12/8/20 | $1.01 | $4.04 |
| Lancaster Colony | LANC | 12/4/20 | 12/7/20 | 12/31/20 | $0.75 | $3.00 |
| Lowe’s Companies | LOW | 1/19/21 | 1/20/21 | 2/3/21 | $0.60 | $2.40 |
| National Fuel Gas | NFG | 9/29/20 | 9/30/20 | 10/15/20 | $0.44 | $1.78 |
| Nordson | NDSN | 8/24/20 | 8/25/20 | 9/8/20 | $0.39 | $1.56 |
| Northwest Natural Hldg | NWN | 10/29/20 | 10/30/20 | 11/13/20 | $0.48 | $1.92 |
| Parker Hannifin | PH | 11/5/20 | 11/6/20 | 12/4/20 | $0.88 | $3.52 |
| Procter & Gamble | PG | 10/22/20 | 10/23/20 | 11/16/20 | $0.79 | $3.16 |
| SJW Gr | SJW | 11/6/20 | 11/9/20 | 12/1/20 | $0.32 | $1.28 |
| Stanley Black & Decker | SWK | 11/30/20 | 12/1/20 | 12/15/20 | $0.70 | $2.80 |
| Stepan | SCL | 11/27/20 | 11/30/20 | 12/15/20 | $0.31 | $1.22 |
| Sysco | SYY | 1/7/21 | 1/8/21 | 1/29/21 | $0.45 | $1.80 |
| Target | TGT | 11/17/20 | 11/18/20 | 12/10/20 | $0.68 | $2.72 |
| Tootsie Roll Industries | TR | 6/12/20 | 6/15/20 | 7/6/20 | $0.09 | $0.36 |
Here are my recommendations:
Affiliates
- Simply Investing Report & Analysis Platform or the Course can teach you how to invest in stocks. Try it free for 14 days.
- Free Dividend Kings Spreadsheet from Sure Dividend, complete with Buy/Hold/Sell recommendations, dividend histories, and much more. It is an excellent resource for DIY dividend growth investors and retirees.
- Stock Rover is the leading investment research platform with all the fundamental metrics, screens, and analysis tools you need. Try it free for 14 days.
Receive a free e-book, “Become a Better Investor: 5 Fundamental Metrics to Know!” Join thousands of other readers !
*This post contains affiliate links meaning that I earn a commission for any purchases that you make at the Affiliates website through these links. This will not incur additional costs for you. Please read my disclosure for more information.
Prakash Kolli is the founder of the Dividend Power site. He is a self-taught investor, analyst, and writer on dividend growth stocks and financial independence. His writings can be found on Seeking Alpha, InvestorPlace, Business Insider, Nasdaq, TalkMarkets, ValueWalk, The Money Show, Forbes, Yahoo Finance, and leading financial sites. In addition, he is part of the Portfolio Insight and Sure Dividend teams. He was recently in the top 1.0% and 100 (73 out of over 13,450) financial bloggers, as tracked by TipRanks (an independent analyst tracking site) for his articles on Seeking Alpha.
2 thoughts on “The List Of Dividend Kings In 2020”