
Another essential financial term investors must know is a “bull market.” Stock prices usually rise and fall, but when they increase consistently over an extended time, it is referred to as a bull market. The definition of a bull market is not strictly by a certain percentage rise, which is conceptually distinct from a bear market. Recall a bear market is described as when stock prices fall by 20% or more from a recent high. The bull market from early 2009 until 2020 lasted the longest in history.
Affiliate
Stock Rover is an award winning investment research platform.
- The site has 8,500+ stocks, 4,000 ETFs, and 40,000 mutual funds.
- Access to 650+ metrics, financial data, market news, stock and fund ratings, fair value, margin of safety, etc.
- Includes brokerage integration, portfolio tracking, rebalancing, watchlists, alerts, future income forecasts, etc.
Click here to try Stock Rover for free (14-day free trial).
Bull Market Definition
A bull market is a lengthy rise in stock prices. A formal metric, like a percentage, does not define a bull market. However, one common rule of thumb used by analysts and investors is that a bull market is when stocks move up 20% from a recent low. Another definition is a bull market happens when stocks rise 20%+ in a two-month stretch. Yet another way to define the term is that the period between two bear markets is a bull market.
Often the expression is used in reference to an index, like the Dow Jones Industrial Averages (DJIA), Nasdaq Composite Index, or the S&P 500 Index for stocks. But a bull market can occur for other asset classes, including bonds, currencies, commodities, gold, and real estate.
Bull markets can last months to years. A cyclical bull market can last months, while a secular bull may last many years. However, since no clear metric delineates the idea, the quantity, average duration, and average percentage gain vary between different definitions.
If we assume the expression is defined as the period between two bear markets; the average bull market is about 3.8 years. The longest one is approximately 11 years between the Great Recession and the beginning of the COVID-19 pandemic.
Other definitions will result in varying time spans. For instance, yet another explanation is a bull market is a time from the lowest close reached after the stock market has fallen at least 20% to the next market high. In this case, the average bull market for the S&P 500 Index is 8.9 years, with an average cumulative return of 468%.
Stages
Bull markets are usually divided into four stages. Typically, they occur in the following sequence as defined by Sir John Templeton, who said,
“Bull markets are born on pessimism, grown on skepticism, mature on optimism, and die on euphoria.”
Stage 1 – Pessimism – This stage starts near the finish of a bear market or correction. The economy is performing poorly, and stocks have punished investors. Mutual funds and ETFs are probably still experiencing net outflows. However, valuations are down, and dividend yields are up, presenting an opportunity.
Stage 2 – Skepticism – The market has probably stopped declining and may be flat or even rising at this stage. But the great majority of investors are still worried and skeptical about economic growth. They doubt revenue and earnings will increase and are concerned about further losses. As a result, volatility is likely still elevated.
Stage 3 – Optimism – Sentiment shifts from bearish to bullish, driven by improved economic data, positive company results, and better news. Investors start returning to the market. Mutual funds and ETFs have positive inflows. Volatility is reduced, valuations start to rise, while yields come down.
Stage 4 – Euphoria – Stock prices are rising rapidly in this stage. Investors feel that the economy and stock prices can only go upward. Many beginner investors may start entering the market, driving prices even higher. Other characteristics of this phase include climbing IPO numbers, focusing on alternate assets, and less emphasis on revenue and earnings. High valuations are justified by metrics like eyeballs, subscribers, and recurring revenue percentages. The euphoria stage is also referred to as the “melt-up” phase by Jeremy Grantham.
Why Do Bull Markets Occur?
Bull markets are the converse of bear markets. They are characterized by investor optimism and confidence about the economy and corporation earnings. Investor expectations are generally met or exceeded each quarter. Hence, the demand for stocks is high. Shareholders often see rising prices, reassess their assumptions, and may buy stocks.
Generally, bullish sentiment pushes stocks higher, and risk aversion is low. The longer rise in stocks is interrupted by periodic downward movement, but the trend is typically upward. Eventually, demand wanes, and the market peaks, followed by a correction or bear market.
The reasons for a bull market differ. But the Gross Domestic Product (GDP) is usually rising, and unemployment is low. Companies experience growing revenue, net profits, and cash flow. They typically reward shareholders with higher dividends and share buybacks. The net result is rising investor optimism and confidence driving demand for stocks.
Other factors influencing a bull market are low inflation, higher productivity, and government actions. A fiscal or monetary stimulus may cause shifts in investor sentiment resulting in more demand for stocks. In addition, lower interest rates or central bank bond buying may make money cheap, producing higher demand for stocks and other asset classes.
Bull Market Facts
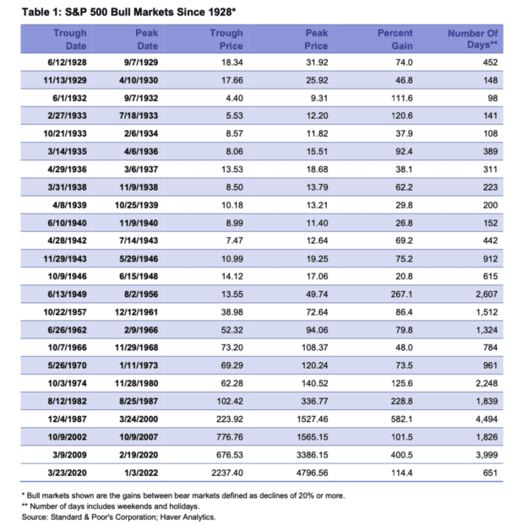
According to Yardeni Research, since 1928, the shortest bull market was 98 days from June 1, 1932, to September 7, 1932, during the COVID-19 pandemic. Bull markets of the S&P 500 Index are shown in the table below.
The longest bull market was 4,494 days or 147.75 months or 12.31 years from December 4, 1987, to March 24, 2000, after Black Monday in 1987 to the dotcom crash.
Using an alternate definition and First Trust research, the longest bull market was 15.1 years from after World War II to the early-1960s.
Bull markets are getting longer in duration. Before WW II, not even one was longer than 1,000 days. In more recent times, most bull markets are lengthier. Since 1943, the average lifespan has been 5.3 years.
Example of Bull Markets
Longest Secular Bull Market
The longest secular bull market was between 1982 and 2000. It started at the end of a period of high inflation and interest rates and concluded with the dotcom crash. The stock market was interrupted by a severe downturn in 1987, known as Black Monday. After that, however, the general trend was upward until the puncturing of the dotcom bubble.
During this stretch, the S&P 500 Index increased from 102.42 on August 12, 1982, to 1,527.46 on March 24, 2000, an almost 15 times increase. Additionally, the Dow 30 averaged 15% annualized returns. Tech stocks increased, too, particularly toward the end of the 1990s during the dotcom bubble. The secular bull market ended quickly, followed by a prolonged bear market coined the dotcom bust.
Post-World War II
The first bull market lasting more than 1,000 days, occurred after World War II. The war’s end resulted in a protracted economic boom and a market rally. Americans returning from the war were flush with cash and started the Baby Boom. Young families spent money on housing, cars, furniture, clothing, etc. In addition, the United States manufacturing base was relatively unscathed, so exports increased.
The S&P 500 Index rose from 13.55 on June 13, 1949, to 49.74 on August 23, 1956, nearly quadrupling. The long rally finished when the U.S. Federal Reserve started raising interest rates, causing a short bear market.
Record-Breaking Bull Run
The record-breaking bull run between March 9, 2009, and February 19, 2000, lasted 3,999 days or 131.4 months or 10.95 years. Stocks performed poorly during the Great Recession, triggered by the subprime mortgage crisis. Technology stocks led the gain fueled by advances in smartphones, social media, and the cloud.
During this stretch, the S&P 500 Index rose from 676.53 to 3,386.15, an almost fivefold increase. On paper, the S&P 500 added trillions of dollars in wealth. The Dow Jones peaked at a record value of 29,551 on February 12, 2020.
The lengthy bull run ended because of the rapidly spreading coronavirus and the start of the global COVID-19 pandemic. In addition, consumer and business fear combined with government restrictions limited business activity and resulted in a spike in unemployment.
Bottom Line
By definition bull markets are lengthy periods of rising stock market prices. Upbeat and confident investors buy stocks driving stock prices. Demand stays high because of good economic reports, increasing revenue and earnings, and low unemployment. Moreover, interest rates are typically low. On average, bull markets are longer lasting than bear markets, and it is impossible to time the start and end of one. Consequently, staying invested using a long-term strategy rather than attempting to time the market is prudent.
Related Articles on Dividend Power
Here are my recommendations:
Affiliates
- Simply Investing Report & Analysis Platform or the Course can teach you how to invest in stocks. Try it free for 14 days.
- Free Dividend Kings Spreadsheet from Sure Dividend, complete with Buy/Hold/Sell recommendations, dividend histories, and much more. It is an excellent resource for DIY dividend growth investors and retirees.
- Stock Rover is the leading investment research platform with all the fundamental metrics, screens, and analysis tools you need. Try it free for 14 days.
Receive a free e-book, “Become a Better Investor: 5 Fundamental Metrics to Know!” Join thousands of other readers !
*This post contains affiliate links meaning that I earn a commission for any purchases that you make at the Affiliates website through these links. This will not incur additional costs for you. Please read my disclosure for more information.
Prakash Kolli is the founder of the Dividend Power site. He is a self-taught investor, analyst, and writer on dividend growth stocks and financial independence. His writings can be found on Seeking Alpha, InvestorPlace, Business Insider, Nasdaq, TalkMarkets, ValueWalk, The Money Show, Forbes, Yahoo Finance, and leading financial sites. In addition, he is part of the Portfolio Insight and Sure Dividend teams. He was recently in the top 1.0% and 100 (73 out of over 13,450) financial bloggers, as tracked by TipRanks (an independent analyst tracking site) for his articles on Seeking Alpha.