
This article provides an updated list of the Dividend Kings in 2023, select financial data, and analysis. The list and data are updated monthly and are located at the bottom of the article.
The Dividend Kings in 2022 are stocks on United States stock exchanges that have increased their dividends for at least 50 consecutive years. To attain the 50-year mark is not easy; the list of Dividend Kings is very select. Only 43 New York Stock Exchange (NYSE) and NASDAQ companies have done so. This number is out of nearly 6,000 companies listed on NYSE and NASDAQ in 2023, indicating a success rate of approximately 0.72%.
The number of Dividend Kings increases slightly to 44 if we include over-the-counter (OTC) stocks. The total universe of U.S. stocks also goes up to about 11,500, indicating an even lower success rate of about 0.38% for companies to achieve Dividend King status. There are a few discrepancies in the Dividend Kings list; we discuss those below.
Why are the Dividend Kings Important?
The Dividend Kings are successful companies. They have survived periods of inflation, stock market crashes, global crisis, and deep recessions. In the past 50 years, their dividends have survived seven recessions, the Vietnam War, the Gulf War, the fall of the Berlin Wall and the Soviet Union, 9/11 in 2001, the dot-com bust, the Great Recession, and the COVID-19 pandemic.
The 2023 Dividend Kings may not have grown revenue and earnings per share yearly, but they raised the dividend without fail. This length of time points to the durability of their businesses and the sustainability of their dividends. This fact is essential for investors seeking to produce passive income for retirement or build wealth. Moreover, dividends are important since they are a significant component of total returns.
Despite some close calls, no Dividend King has cut or suspended its dividend due to the COVID-19 pandemic.
Reportedly, the last Dividend King to leave the divided constant and fall off the list was Diebold in 2014, now known as Diebold Nixdorf (DDB). The company eventually cut the dividend. Before Diebold, AON plc (AON) fell off the list in 2003. However, a few companies have fallen off the list because another company acquired them. Nevertheless, the persistence of the dividend for the Dividend Kings demonstrates the success of these companies and their ability to return cash to shareholders through dividends.
Affiliate
Free Dividend Kings Spreadsheet from Sure Dividend, complete with Buy/Hold/Sell recommendations, dividend histories, and much more.
Market Update for the 2023 Dividend Kings
The Dividend Kings are currently trading at an elevated valuation of a trailing average price-to-earnings ratio of about 23.81X. This multiple is down from its peak of more than 31X in May 2021 due to declining stock prices and rising earnings.
The current average dividend yield is about 2.79%. The average trailing 10-year dividend growth rate is about 6.63%, and the average past 5-year growth rate is around 5.31%. The mean payout ratio is approximately 57.98%. The average market cap is currently $63,421 million.
Currently, the Dividend King with the highest yield is Altria (MO) at about 9.5%, and the one trading with the lowest earnings multiple is Nucor (NUE).
You can look at updated, select financial data and the dividend earnings calendar for each stock in the Dividend Kings list in the tables at the end of the article. The most recent dividend increases are also available for you to search.
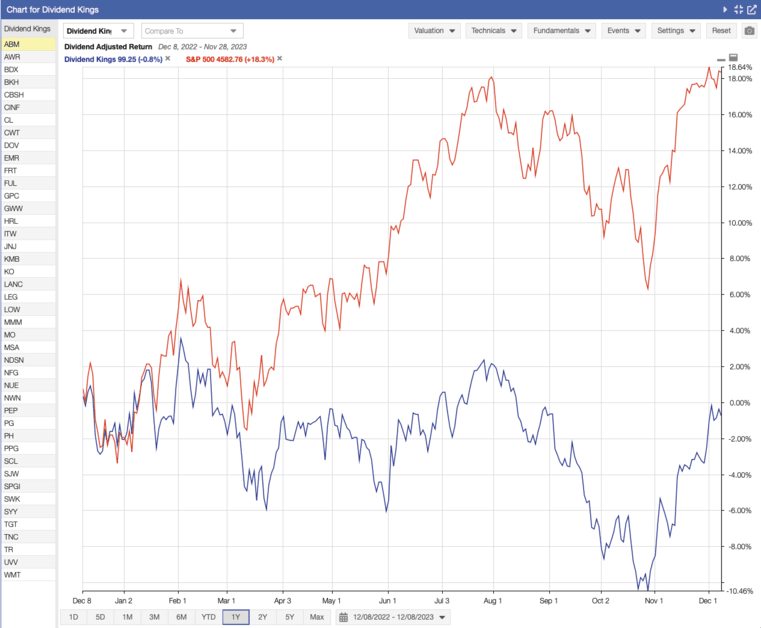
According to Stock Rover* in the trailing 1-year, the Dividend Kings have returned -0.8% (blue line) compared to +18.4% for the S&P 500 Index benchmark (red line), as seen in the chart below.Over the trailing 5-years, the Dividend Kings have returned +62.0%, and the S&P 500 Index has returned +85.0%.
Affiliate
Stock Rover is an award winning investment research platform.
- The site has 8,500+ stocks, 4,000 ETFs, and 40,000 mutual funds.
- Access to 650+ metrics, financial data, market news, stock and fund ratings, fair value, margin of safety, etc.
- Includes brokerage integration, portfolio tracking, rebalancing, watchlists, alerts, future income forecasts, etc.
Click here to try Stock Rover for free (14-day free trial).
Additions to the Dividend Kings in 2022
In 2022, Becton, Dickinson (BDX), Kimberly-Clark (KMB), PepsiCo (PEP), and Tennant (TNC) were added to the list of Dividend Kings.
Becton, Dickinson is a large manufacturer of medical supplies, devices, and laboratory equipment.
Kimberly-Clark manufactures and sells personal care and tissue products. The company owns brands like Huggies, Pull-Ups, Kleenex, Scott, Kotex, etc.
PepsiCo is a leading non-alcoholic and snack company. Its brands include Pepsi, Mountain Dew, Gatorade, Lays, Doritos, Quaker, Cheetos, etc. It has 22+ brands with $1 billion in sales.
Tennant is probably the least well-known and smallest of the additions. The firm design and makes floor cleaning equipment.
Deletions to the Dividend Kings in 2022
One over-the-counter stock, Computer Services (CSVI) is no longer on the list. It was acquired Centerbridge Partners and Bridgeport Partners for $1.6 billion in cash.
Other Dividend Stock Lists
We have also written articles with several other lists and analyses on US dividend growth stocks, including:
- List of Dividend Aristocrats in 2023
- List of Dividend Champions in 2023
- List of Dividend Contenders in 2023
- List of Dividend Challengers in 2023
- Dogs of the Dow in 2023
For Canadian stocks, I have written about
For UK stocks, I have written about
Other dividend stock lists
Some Details on the 2023 Dividend Kings
Water Utilities Have a Major Presence
The longest track record as a Dividend King is American States Water (AWR), with a 69-year history of increases. There were four water utilities on this list at the start of 2019. But Connecticut Water Service (CTWS) was acquired by SJW Corp (SJW) in 2019. This acquisition reduced the number to three.
It is not surprising that water utilities have a high representation on this list. They provide an essential product for consumers and industries. The business does not grow fast, but it grows with population increases over time. The market and dividend growth investors have broadly recognized this point now, and water utilities often trade at elevated valuations, but they exhibit low volatility.
The three remaining water utilities on the Dividend Kings list have been trading at earnings multiples greater than the broader market for some time. For instance, American States Water trades at price-to-earnings ratio of over ~37.6X. California Water Service (CWT) trades at a P/E ratio of ~30.6X. SJW (SJW) trades at a P/E ratio of 30.5X.
Related Articles About Water Utilities on Dividend Power
Only One REIT on the Dividend Kings 2023 List
Only one real estate investment trust (REIT) is on the list, Federal Realty Investment Trust (FRT). The firm is a shopping center REIT that operates in eight metropolitan areas.
In addition, there are currently no master limited partnerships (MLPs) on the list.
Related Articles About Federal Realty Investment Trust (FRT) on Dividend Power
Dividend Aristocrats
Many companies from the S&P 500 Dividend Aristocrats list are on the 2023 Dividend Kings list. A Dividend Aristocrat is a company that has raised the dividend for at least 25 consecutive years. However, it is not necessary for a company to be on the Dividend Aristocrats list to be a Dividend King.
Market Capitalization of the 2023 Dividend Kings
Interestingly, the list is not dominated by large-cap companies but includes quite a few mid-cap companies ($2 billion – $10 billion) and small-cap companies ($300 million – $2 billion).
The largest market capitalization company on the Dividend Kings list is Johnson & Johnson (JNJ), at about $427 billion. Conversely, the smallest company on the Dividend Kings list by market capitalization is Tennant (TNC), at about $1.3 billion.
Lastly, one over-the-counter stocks could be on the Dividend Kings list: Farmers & Merchants Bancorp (FMBC).
Affiliate
Portfolio Insight is a leading portfolio management and research platform.
- 9,000+ stocks and ETFs in its database
- Access up to dozens of metrics, 20-years of financial data from S&P Global, fair value, margin of safety, charting, etc.
- Avoid dividend cuts with the Dividend Quality Grade and screening tools.
Click here to try Portfolio Insight for free (14-day free trial).
What Do I like About the Dividend Kings?
The Dividend King list in 2023 serves as a screen for further investigating a stock for a dividend growth portfolio. It lists companies with stable businesses with competitive advantages and has returned cash to shareholders consistently through dividends for an extended period. As a dividend growth investor, this is a place to start.
Some investors ask, “What’s the big deal about the Dividend Kings?” It is a measure of success and diligence in returning cash to shareholders through dividends. These companies are not the highest-growth ones, but they grow over time.
In addition, the Dividend Kings list changes only very slowly. Each year there are a few additions on average. However, the Dividend Kings list exhibits persistence. Once a company is on the list, it tends to stay on it. This fact is probably due to the effort by each company’s management to maintain the dividend.
Are Companies Ever Deleted from the Dividend Kings List?
Sometimes companies are deleted from the Dividend Kings list due to mergers and acquisitions. For instance, Vectren and Connecticut Water Service were deleted from the list in 2019 because they were acquired. CenterPoint Energy (CNP) acquired Vectren, and SJW Group (SJW), another Dividend King, acquired Connecticut Water Service.
However, some companies do fall off the list for not raising the dividend or, even worse, cutting or suspending the dividend. In the past, this has included Winn-Dixie (WINN), Ohio Casualty Corp (eventually acquired), Aon plc (AON), Integrys Energy Group (TEG), Masco (MSA), and Diebold (DBD).
Readers can learn more on the Dividend Growth Investor blog about the evolution of the Dividend Kings list over the years. But in general, most of these companies had several years of operational difficulties or high leverage. Eventually, this led to a freeze or cut in the dividend and subsequent removal from the list. The bottom line is earnings per share (EPS) and free cash flow (FCF) must grow over time for a company to become a Dividend King.
Dividend Kings Historical Performance
In absolute terms, the Dividend Kings have solid performance. The Dividend Kings have performed better than the S&P 500 Index, with lower volatility over the past 20 years, starting in 1999 through the end of 2019. The 29 Dividend Kings during this time had a compound annual growth rate or CAGR of approximately 24.7% versus about 22.9% for the S&P 500 Index. The internal rate of return or IRR is about 11.6% for the Dividend Kings and roughly 9.2% for the S&P 500.
There are three reasons for this. First, the Dividend Kings have fewer years with negative returns. The Dividend Kings had only two down years during this period, while the S&P 500 had four down years.
Next, the S&P 500 Index’s worst down years were much worse than that of the Dividend Kings. The worst year for the Dividend Kings was only -17.62%, while the worst year for the S&P 500 Index was a whopping -36.81%, or more than double that of the Dividend Kings. The S&P 500 Index could not make this up in the best year.
Lastly, the Dividend Kings outperformed the S&P 500 in 12 out of 20 years. For more details, read the Dividend Kings versus S&P 500.
Volatility
Furthermore, the Dividend Kings experienced lower volatility than the S&P 500 Index during the period analyzed. The standard deviation of returns was about 12.5% for the Dividend Kings versus roughly 14.4% for the S&P 500 Index. The combination of higher rates of return and lower standard deviation results in a higher Sharpe ratio of 0.74 for the Dividend Kings versus 0.39 for the S&P 500 Index, based on monthly returns and a 1-month U.S. Treasury bill. This fact indicates that the Dividend Kings have higher risk-adjusted performance than the S&P 500 Index.
In some stretches, the Dividend Kings have underperformed the S&P 500. This fact can be attributed to the long bull market and the outperformance of the S&P 500 Index from 2020 to 2021. However, during down years, the Dividend Kings tend to outperform the S&P 500 Index, as observed during the bear market in 2022.
Discrepancies in the 2023 Dividend Kings
There are seven discrepancies on the Dividend Kings 2023 list. Target (TGT), Illinois Tool Works (ITW), Altria (MO), Tootsie Roll Industries (TR), Sysco (SYY), Farmers & Merchants Bancorp (FMBC), and Computer Services (CSVI) regarding the number of years that they have paid a growing dividend or whether they are on the list or not.
Target
According to its website, Target has paid a growing annual dividend for at least 50 years. From 1970 to 1971, Target paid a yearly cash dividend of $0.0104. In 1972, the company raised the dividend to $0.0108. So, based on this information, Target has increased the annual dividend for 50 years. However, some lists and websites show Target raising the dividend for 55 years. A stock split may cause this discrepancy. Target initiated a dividend at the end of 1967, paying a dividend for 55 consecutive years. There was a 2:1 stock split in 1969, which may confuse the issue. However, Target is now clearly on the Dividend Kings list.
Illinois Tool Works
The second discrepancy is for Illinois Tool Works (ITW). The company has paid a growing dividend for at least 50 years. However, the company has claimed a more extended period, and some websites also show a 58-year dividend history. I refer to the excellent research by Dividend Growth Investor, who determined that ITW did not raise its dividend in 1971. The company acknowledged this in its 2019 ITW Annual Report, stating, “ITW’s annual dividend payment has increased for more than 56 consecutive years, except during a period of government controls in 1971.” ITW did start increasing its dividend again in 1972. However, ITW is now clearly on the Dividend Kings list.
Altria
Altria Group (MO) is the third stock with a discrepancy. The company was part of Philip Morris (PM) and was separated in 2008. The dividend was cut, but the combined dividend was reportedly the same as before the split. However, due to the divestment and reduction in the dividend, some datasets report Altria with only 12 years of dividend growth. The quantitative rules used by Portfolio Insight* make this a dividend cut. Hence, we have not included Altria in the Dividend Kings list.
Related Articles About Altria (MO) on Dividend Power
Tootsie Roll
The fourth discrepancy is Tootsie Roll. Tootsie Roll does increase its regular annual cash dividend periodically. However, the stock does not have at least 50 consecutive increases in the yearly dividend. So why do some lists include Tootsie Roll as a Dividend King? The company also pays a 3% stock dividend annually, recorded as a 103-to-100 stock split. This split results in an adjustment to past dividends each year and increases the cash paid to shareholders annually. Again, however, Tootsie Roll is on the Dividend Kings list.
Sysco
The fifth discrepancy is Sysco (SYY). Sysco claims to have raised the dividend for more than 50 consecutive years in their press releases. In addition, several datasets state Sysco has raised the dividend for 50 years. However, their investor relations website shows the dividend was held constant from 1975 to 1976. Sysco is retained on the list until further clarification.
Abbott
The next discrepancy us Abbott Laboratories (ABT). AbbVie was divested from Abbott in 2013 because of patent expirations and the capital required for a large R&D pharma company. The total dividend never declined, but each company had a lower dividend than before the separation. However, due to the divestment and reduction in the dividend, some datasets report Abbott with only 10 years of dividend growth. The quantitative rules used by Portfolio Insight* make this a dividend cut. Hence, we have not included Abbott in the Dividend Kings list.
Related Articles About Abbott and AbbVie on Dividend Power
- AbbVie (ABBV): An Undervalued Dividend Aristocrat
- AbbVie (ABBV): Dividend Safety Is Pressured by Humira
Farmers & Merchants Bancorp
The following discrepancy is Farmers & Merchants Bancorp (FMBC). The bank has raised the dividend for more than 50 years in a row. However, the bank trades over the counter and is only very thinly traded. This fact means more significant risks for small investors. It also means the stock is not in some datasets based on the NYSE and NASDAQ. Hence, I have omitted this bank from the Dividend Kings list.
Computer Services
Another discrepancy is Computer Services (CSVI). The company has raised the dividend for over 50 consecutive years. However, the stock trades over the counter and is again thinly traded. This fact means more significant risks for small investors. It also means the stock is not in some datasets based on the NYSE and NASDAQ. Hence, I have omitted this company from the Dividend Kings list.
Who’s On Deck?
Multiple Dividend Champions have raised their dividend for 49 years. This list includes Consolidated Edison (ED), Nucor (NUE), RPM International (RPM), and Walmart (WMT).
List of Dividend Kings in 2023
Stock Rover* and Portfolio Insight* were used to create this table.
| Ticker | Company Name | No. Years | Dividend Yield (%) | 10-yr Dividend Growth Rate (%) | Payout Ratio (%) | TTM P/E Ratio | Market Cap (millions) |
|---|---|---|---|---|---|---|---|
| ABM | ABM Indus | 56 | 2.20 | 3.80 | 23.10 | 10.9 | $2,599 |
| AWR | American States Water | 69 | 2.20 | 7.80 | 48.70 | 23.6 | $2,905 |
| BDX | Becton Dickinson | 51 | 1.60 | 5.70 | 73.20 | 46.1 | $68,042 |
| BKH | Black Hills | 53 | 4.90 | 5.10 | 64.90 | 13.4 | $3,507 |
| CBSH | Commerce Bancshares | 55 | 2.10 | 7.50 | 26.90 | 13.9 | $6,834 |
| CINF | Cincinnati Financial | 63 | 2.80 | 6.00 | 27.80 | 10.2 | $16,834 |
| CL | Colgate-Palmolive | 60 | 2.40 | 3.50 | 99.00 | 42.2 | $66,223 |
| CWT | California Water Servs Gr | 56 | 2.20 | 5.00 | 139.20 | 64.9 | $2,764 |
| DOV | Dover | 68 | 1.40 | 3.10 | 27.70 | 20.1 | $20,453 |
| EMR | Emerson Electric | 66 | 2.30 | 2.00 | 9.00 | 25.1 | $53,300 |
| FRT | Federal Realty Investment | 56 | 4.30 | 3.40 | 125.90 | 29.6 | $8,317 |
| FUL | H.B. Fuller | 54 | 1.00 | 7.40 | 28.80 | 29.5 | $4,236 |
| GPC | Genuine Parts | 67 | 2.70 | 5.90 | 42.10 | 15.8 | $19,599 |
| GWW | W.W. Grainger | 52 | 1.80 | 14.90 | 19.90 | 23.4 | $41,719 |
| HRL | Hormel Foods | 57 | 3.60 | 10.90 | 75.90 | 21.6 | $17,127 |
| ITW | Illinois Tool Works | 60 | 2.20 | 12.80 | 51.60 | 24.6 | $76,334 |
| JNJ | Johnson & Johnson | 61 | 3.00 | 6.10 | 34.60 | 30.1 | $386,416 |
| KMB | Kimberly-Clark | 51 | 3.80 | 3.80 | 90.20 | 23.6 | $41,590 |
| KO | Coca-Cola | 61 | 3.10 | 5.10 | 73.40 | 24.3 | $259,361 |
| LANC | Lancaster Colony | 61 | 2.10 | 7.40 | 79.60 | 40.2 | $4,713 |
| LEG | Leggett & Platt | 52 | 7.80 | 4.40 | 114.70 | 14.8 | $3,103 |
| LOW | Lowe's Companies | 61 | 2.00 | 19.80 | 32.90 | 16.9 | $126,772 |
| MMM | 3M | 65 | 5.60 | 9.00 | 59.01 | 10.66 | $59,451 |
| MO | Altria Group | 53 | 9.60 | 7.40 | 77.60 | 8.4 | $72,461 |
| MSA | MSA Safety | 52 | 1.20 | 4.60 | 216.30 | 192.3 | $6,407 |
| NDSN | Nordson | 60 | 1.10 | 14.20 | 30.80 | 29.6 | $14,284 |
| NFG | National Fuel Gas | 53 | 4.00 | 2.80 | 37.30 | 9.5 | $4,513 |
| NUE | Nucor | 50 | 1.30 | 3.90 | 10.30 | 8.6 | $41,989 |
| NWN | Northwest Natural Hldg | 67 | 5.20 | 0.60 | 70.30 | 13.7 | $1,391 |
| PEP | PepsiCo | 51 | 3.00 | 8.30 | 80.20 | 27.7 | $228,461 |
| PG | Procter & Gamble | 67 | 2.50 | 4.60 | 58.50 | 24.3 | $353,037 |
| PH | Parker Hannifin | 67 | 1.30 | 12.60 | 30.70 | 25.5 | $59,195 |
| PPG | PPG Indus | 52 | 1.80 | 7.90 | 41.80 | 24.1 | $33,898 |
| SCL | Stepan | 55 | 1.70 | 8.20 | 63.50 | 38.8 | $1,973 |
| SJW | SJW Gr | 56 | 2.40 | 7.60 | 46.70 | 19.8 | $2,019 |
| SPGI | S&P Global | 50 | 0.80 | 12.40 | 46.00 | 56.8 | $138,299 |
| SWK | Stanley Black & Decker | 56 | 3.40 | 4.90 | 68.87 | 20.82 | $14,457 |
| SYY | Sysco | 53 | 2.70 | 6.00 | 55.50 | 21.1 | $37,777 |
| TGT | Target | 56 | 3.10 | 9.80 | 55.10 | 18 | $65,126 |
| TNC | Tennant | 51 | 1.20 | 4.50 | 19.20 | 16.6 | $1,700 |
| TR | Tootsie Roll Industries | 57 | 1.10 | 4.20 | 28.60 | 27.5 | $2,142 |
| UVV | Universal | 52 | 5.40 | 4.60 | 64.90 | 12.1 | $1,446 |
| WMT | Walmart | 50 | 1.40 | 1.90 | 37.70 | 27 | $435,684 |
Dividend Calendar for the Dividend Kings 2023
Stock Rover* was used for creating this table.
| Ticker | Company | Ex-Dividend Date | Div. Record Date | Dividend Payment Date | Dividend Frequency | Next Div. Payment Per Share | Dividend Per Share |
|---|---|---|---|---|---|---|---|
| ABM | ABM Indus | 10/4/23 | 10/5/23 | 11/6/23 | 4 | $0.22 | $0.88 |
| AWR | American States Water | 11/14/23 | 11/15/23 | 12/1/23 | 4 | $0.43 | $1.72 |
| BDX | Becton Dickinson | 12/7/23 | 12/8/23 | 12/29/23 | 4 | $0.95 | $3.80 |
| BKH | Black Hills | 11/16/23 | 11/17/23 | 12/1/23 | 4 | $0.62 | $2.50 |
| CBSH | Commerce Bancshares | 12/1/23 | 12/4/23 | 12/18/23 | 4 | $0.27 | $1.08 |
| CINF | Cincinnati Financial | 12/18/23 | 12/19/23 | 1/16/24 | 4 | $0.75 | $3.00 |
| CL | Colgate-Palmolive | 10/20/23 | 10/23/23 | 11/15/23 | 4 | $0.48 | $1.92 |
| CWT | California Water Servs Gr | 11/3/23 | 11/6/23 | 11/17/23 | 4 | $0.26 | $1.04 |
| DOV | Dover | 11/29/23 | 11/30/23 | 12/15/23 | 4 | $0.51 | $2.04 |
| EMR | Emerson Electric | 11/16/23 | 11/17/23 | 12/11/23 | 4 | $0.52 | $2.10 |
| FRT | Federal Realty Investment | 12/29/23 | 1/2/24 | 1/16/24 | 4 | $1.09 | $4.36 |
| FUL | H.B. Fuller | 10/18/23 | 10/19/23 | 11/2/23 | 4 | $0.20 | $0.81 |
| GPC | Genuine Parts | 11/30/23 | 12/1/23 | 1/2/24 | 4 | $0.95 | $3.80 |
| GWW | W.W. Grainger | 8/11/23 | 8/14/23 | 9/1/23 | 4 | $1.86 | $7.44 |
| HRL | Hormel Foods | 1/12/24 | 1/16/24 | 2/15/24 | 4 | $0.28 | $1.13 |
| ITW | Illinois Tool Works | 12/28/23 | 12/29/23 | 1/11/24 | 4 | $1.40 | $5.60 |
| JNJ | Johnson & Johnson | 11/20/23 | 11/21/23 | 12/5/23 | 4 | $1.19 | $4.76 |
| KMB | Kimberly-Clark | 12/7/23 | 12/8/23 | 1/3/24 | 4 | $1.18 | $4.72 |
| KO | Coca-Cola | 11/30/23 | 12/1/23 | 12/15/23 | 4 | $0.46 | $1.84 |
| LANC | Lancaster Colony | 12/1/23 | 12/4/23 | 12/29/23 | 4 | $0.90 | $3.60 |
| LEG | Leggett & Platt | 12/14/23 | 12/15/23 | 1/12/24 | 4 | $0.46 | $1.82 |
| LOW | Lowe's Companies | 1/23/24 | 1/24/24 | 2/7/24 | 4 | $1.10 | $4.40 |
| MMM | 3M | 11/16/23 | 11/17/23 | 12/12/23 | 4 | $1.50 | $6.00 |
| MO | Altria Group | 12/20/23 | 12/21/23 | 1/10/24 | 4 | $0.98 | $3.92 |
| MSA | MSA Safety | 11/14/23 | 11/15/23 | 12/10/23 | 4 | $0.47 | $1.88 |
| NDSN | Nordson | 12/18/23 | 12/19/23 | 1/2/24 | 4 | $0.68 | $2.72 |
| NFG | National Fuel Gas | 12/28/23 | 12/29/23 | 1/12/24 | 4 | $0.50 | $1.98 |
| NUE | Nucor | 9/28/23 | 9/29/23 | 11/9/23 | 4 | $0.51 | $2.04 |
| NWN | Northwest Natural Hldg | 10/30/23 | 10/31/23 | 11/15/23 | 4 | $0.49 | $1.95 |
| PEP | PepsiCo | 11/30/23 | 12/1/23 | 1/5/24 | 4 | $1.26 | $4.95 |
| PG | Procter & Gamble | 10/19/23 | 10/20/23 | 11/15/23 | 4 | $0.94 | $3.76 |
| PH | Parker Hannifin | 11/10/23 | 11/13/23 | 12/1/23 | 4 | $1.48 | $5.92 |
| PPG | PPG Indus | 11/9/23 | 11/10/23 | 12/12/23 | 4 | $0.65 | $2.60 |
| SCL | Stepan | 11/29/23 | 11/30/23 | 12/15/23 | 4 | $0.38 | $1.50 |
| SJW | SJW Gr | 11/3/23 | 11/6/23 | 12/1/23 | 4 | $0.38 | $1.52 |
| SPGI | S&P Global | 11/27/23 | 11/28/23 | 12/12/23 | 4 | $0.90 | $3.60 |
| SWK | Stanley Black & Decker | 11/30/23 | 12/1/23 | 12/19/23 | 4 | $0.81 | $3.24 |
| SYY | Sysco | 1/4/24 | 1/5/24 | 1/26/24 | 4 | $0.50 | $2.00 |
| TGT | Target | 11/14/23 | 11/15/23 | 12/10/23 | 4 | $1.10 | $4.40 |
| TNC | Tennant | 11/29/23 | 11/30/23 | 12/15/23 | 4 | $0.28 | $1.12 |
| TR | Tootsie Roll Industries | 3/3/23 | 3/6/23 | 3/30/23 | 4 | $0.09 | $0.36 |
| UVV | Universal | 1/5/24 | 1/8/24 | 2/5/24 | 4 | $0.80 | $3.20 |
| WMT | Walmart | 12/7/23 | 12/8/23 | 1/2/24 | 4 | $0.57 | $2.28 |
Prior Year Lists and Articles
- List of Dividend Kings in 2022
- List of Dividend Kings in 2021
- List of Dividend Kings in 2020
- List of Dividend Kings in 2019
- 3 Worst Performing Dividend Kings in 2022
- 3 Worst Performing Dividend King Stocks in 2021
- 3 Worst Performing Dividend King Stocks in 2020
Here are my recommendations:
Affiliates
- Simply Investing Report & Analysis Platform or the Course can teach you how to invest in stocks. Try it free for 14 days.
- Free Dividend Kings Spreadsheet from Sure Dividend, complete with Buy/Hold/Sell recommendations, dividend histories, and much more. It is an excellent resource for DIY dividend growth investors and retirees.
- Stock Rover is the leading investment research platform with all the fundamental metrics, screens, and analysis tools you need. Try it free for 14 days.
Receive a free e-book, “Become a Better Investor: 5 Fundamental Metrics to Know!” Join thousands of other readers !
*This post contains affiliate links meaning that I earn a commission for any purchases that you make at the Affiliates website through these links. This will not incur additional costs for you. Please read my disclosure for more information.
Prakash Kolli is the founder of the Dividend Power site. He is a self-taught investor, analyst, and writer on dividend growth stocks and financial independence. His writings can be found on Seeking Alpha, InvestorPlace, Business Insider, Nasdaq, TalkMarkets, ValueWalk, The Money Show, Forbes, Yahoo Finance, and leading financial sites. In addition, he is part of the Portfolio Insight and Sure Dividend teams. He was recently in the top 1.0% and 100 (73 out of over 13,450) financial bloggers, as tracked by TipRanks (an independent analyst tracking site) for his articles on Seeking Alpha.