
The 2026 Canadian Dividend Aristocrats are Canadian stocks that have grown dividends for 5+ years. There are currently 93 stocks on the list. However, five years or more of dividend growth does not by itself qualify a stock as a Canadian Dividend Aristocrat. A company must meet three criteria to be included on the list:
- Be a member of the S&P Canada BMI and Toronto Stock Exchange
- Increased the regular cash dividend per share for 5+ consecutive years but can maintain the same dividend for a maximum of two successive years within those five years. For new additions, the company must have increased its dividend in the first year of the prior five years.
- Have a market capitalization of at least CAD 300 million
In addition, the Canadian Dividend Aristocrats follow these rules.
- The Index is weighted by dividend yield.
- Individual stocks are capped at an 8% weighting and subject to a basket liquidity (BL) maximum weight. BL maximum weight is determined by dividing the three-month average daily value traded by the BL amount of CAD 100 million.
- The Index is updated annually in January.
Notably, these criteria are very different from those used to determine the list of Dividend Aristocrats in the United States. These stocks can be found in the S&P 500 Dividend Aristocrats Index. There are currently 69 constituents of the U.S. index.
On the other hand, there are currently 97 constituents in the Canadian Index. These stocks can be found in the S&P/TSX Canadian Dividend Aristocrats Index. Note that some of the Canadian Dividend Aristocrats also trade on other exchanges.
Affiliate
Stock Rover is an award winning investment research platform.
- The site has 8,500+ stocks, 4,000 ETFs, and 40,000 mutual funds.
- Access to 650+ metrics, financial data, market news, stock and fund ratings, fair value, margin of safety, etc.
- Includes brokerage integration, portfolio tracking, rebalancing, watchlists, alerts, future income forecasts, etc.
Click here to try Stock Rover for free (14-day free trial).
Market Update of the Canadian Dividend Aristocrats 2026
The Canadian Dividend Aristocrats 2026 currently have a yield of about 3.47%, and the average forward price-to-earnings (P/E) ratio is approximately 16.61X.
The mean market capitalization is roughly CAD 38,363 million, and the median is approximately CAD 10,784 million. The market cap ranges between about CAD 398 million to CAD 388,165 million. The total market capitalization is CAD 3,567,770 million.
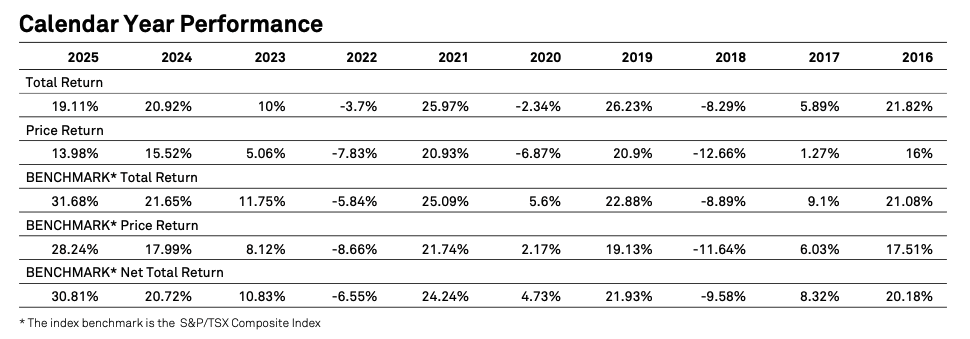
In 2025, the Canadian Dividend Aristocrats provided a total return of 19.11% after two annual positive returns in row and a negative return in 2022. The price return was 13.98%. This performance was worse than the S&P/TSX Composite Index in 2025 at 31.68%.
List of Canadian Dividend Aristocrats in 2026
| Ticker | Name | Sector | Weight (%) |
|---|---|---|---|
| SOBO | SOUTH BOW | Energy | 3.22 |
| WTE | WESTSHORE TERMINALS INVESTMENT | Industrials | 3.09 |
| MTL | MULLEN GROUP | Industrials | 3.01 |
| GEI | GIBSON ENERGY | Energy | 2.85 |
| CNQ | CANADIAN NATURAL RESOURCES LTD | Energy | 2.38 |
| PPL | PEMBINA PIPELINE | Energy | 2.23 |
| CVE | CENOVUS ENERGY | Energy | 2.09 |
| ENB | ENBRIDGE | Energy | 2.05 |
| CRT.UN | CT REIT UNITS TRUST | Real Estate | 2.02 |
| BNS | BANK OF NOVA SCOTIA | Financials | 1.89 |
| SLF | SUN LIFE FINANCIAL INC | Financials | 1.89 |
| ENGH | ENGHOUSE SYSTEMS | Information Technology | 1.85 |
| TRP | TC ENERGY | Energy | 1.73 |
| CU | CANADIAN UTILITIES LTD CLASS A | Utilities | 1.73 |
| CPX | CAPITAL POWER CORP | Utilities | 1.72 |
| TPZ | TOPAZ ENERGY | Energy | 1.71 |
| GWO | GREAT WEST LIFECO INC | Financials | 1.7 |
| BMO | BANK OF MONTREAL | Financials | 1.63 |
| CTC.A | CANADIAN TIRE LTD CLASS A | Consumer Discretionary | 1.58 |
| ACO.X | ATCO CLASS I | Utilities | 1.58 |
| MG | MAGNA INTERNATIONAL | Consumer Discretionary | 1.53 |
| CCA | COGECO COMMUNICATIONS SUBORDINATE | Communication | 1.5 |
| KMP.UN | KILLAM APARTMENT REIT UNITS CLASS | Real Estate | 1.49 |
| TD | TORONTO DOMINION | Financials | 1.49 |
| CGO | COGECO INC | Communication | 1.47 |
| EMA | EMERA INC | Utilities | 1.47 |
| EIF | EXCHANGE INCOME CORP | Industrials | 1.47 |
| CM | CANADIAN IMPERIAL BANK OF COMMERCE | Financials | 1.46 |
| GRT.UN | GRANITE REAL ESTATE INVESTMENT STA | Real Estate | 1.45 |
| POW | POWER CORPORATION OF CANADA | Financials | 1.45 |
| MFC | MANULIFE FINANCIAL | Financials | 1.44 |
| ALA | ALTAGAS | Utilities | 1.41 |
| ARE | AECON GROUP | Industrials | 1.4 |
| QSR | RESTAURANTS BRANDS INTERNATIONAL | Consumer Discretionary | 1.32 |
| FTS | FORTIS | Utilities | 1.28 |
| NTR | NUTRIEN LTD | Materials | 1.27 |
| NWC | NORTH WEST COMPANY INC | Consumer Staples | 1.27 |
| NA | NATIONAL BANK OF CANADA | Financials | 1.2 |
| QBR.B | QUEBECOR CLASS B | Communication | 1.2 |
| JWEL | JAMIESON WELLNESS | Consumer Staples | 1.19 |
| CAR.UN | CANADIAN APARTMENT PROPERTIES REAL | Real Estate | 1.18 |
| RY | ROYAL BANK OF CANADA | Financials | 1.16 |
| TOU | TOURMALINE OIL CORP | Energy | 1.1 |
| CNR | CANADIAN NATIONAL RAILWAY | Industrials | 1.09 |
| IMO | IMPERIAL OIL LTD | Energy | 1.07 |
| BAM | BROOKFIELD ASSET MANAGEMENT VOTING | Financials | 1.03 |
| MFI | MAPLE LEAF FOODS | Consumer Staples | 1.01 |
| SIS | SAVARIA | Industrials | 0.98 |
| OTEX | OPEN TEXT | Information Technology | 0.94 |
| MTY | MTY FOOD GROUP INC | Consumer Discretionary | 0.92 |
| IAG | IA FINANCIAL INC | Financials | 0.91 |
| EQB | EQB | Financials | 0.87 |
| PBH | PREMIUM BRANDS HOLDINGS | Consumer Staples | 0.84 |
| H | HYDRO ONE | Utilities | 0.81 |
| FTT | FINNING INTERNATIONAL INC | Industrials | 0.72 |
| WFG | WEST FRASER TIMBER | Materials | 0.7 |
| TFII | TFI INTERNATIONAL | Industrials | 0.7 |
| NOA | NORTH AMERICAN CONSTRUCTION GROUP | Energy | 0.68 |
| EMP.A | EMPIRE CLASS A | Consumer Staples | 0.68 |
| SAP | SAPUTO | Consumer Staples | 0.61 |
| ADEN | ADENTRA INC | Industrials | 0.61 |
| IFC | INTACT FINANCIAL CORP | Financials | 0.6 |
| CEU | CES ENERGY SOLUTIONS CORP | Energy | 0.6 |
| X | TMX GROUP LTD | Financials | 0.59 |
| CCL.B | CCL INDUSTRIES CLASS B | Materials | 0.55 |
| CJT | CARGOJET | Industrials | 0.54 |
| TIH | TOROMONT INDUSTRIES LTD | Industrials | 0.54 |
| TA | TRANSALTA | Utilities | 0.52 |
| TRI | THOMSON REUTERS CORP | Industrials | 0.52 |
| LNR | LINAMAR | Consumer Discretionary | 0.52 |
| MRU | METRO | Consumer Staples | 0.47 |
| ALS | ALTIUS MINERALS CORP | Materials | 0.46 |
| RCH | RICHELIEU HARDWARE | Industrials | 0.45 |
| WN | GEORGE WESTON | Consumer Staples | 0.45 |
| BDGI | BADGER INFRASTRUCTURE SOLUTIONS LT | Industrials | 0.44 |
| HPS.A | HAMMOND POWER SOLUTIONS CLASS A | Industrials | 0.43 |
| ATD | ALIMENTATION COUCHE TARD INC | Consumer Staples | 0.4 |
| SJ | STELLA JONES | Materials | 0.37 |
| GIL | GILDAN ACTIVEWEAR | Consumer Discretionary | 0.32 |
| EFN | ELEMENT FLEET MANAGEMENT | Industrials | 0.32 |
| L | LOBLAW COMPANIES LTD | Consumer Staples | 0.31 |
| CAD | CAD CASH | Cash and/or Derivatives | 0.3 |
| WCN | WASTE CONNECTIONS | Industrials | 0.26 |
| FNV | FRANCO NEVADA | Materials | 0.24 |
| DOO | BRP SUBORDINATE VOTING | Consumer Discretionary | 0.22 |
| FSV | FIRSTSERVICE SUBORDINATE VOTING | Real Estate | 0.2 |
| WPM | WHEATON PRECIOUS METALS | Materials | 0.19 |
| OR | OR ROYALTIES INC | Materials | 0.17 |
| STN | STANTEC | Industrials | 0.17 |
| BN | BROOKFIELD CLASS A | Financials | 0.15 |
| SVI | STORAGEVAULT CANADA INC | Real Estate | 0.07 |
| USD | USD CASH | Cash and/or Derivatives | 0.07 |
| DOL | DOLLARAMA | Consumer Discretionary | 0.07 |
| BYD | BOYD GROUP SERVICES INC | Industrials | 0.05 |
| GFL | GFL ENVIRONMENTAL SUBORDINATE VOTI | Industrials | 0.04 |
Source: iShares S&P/TSX Canadian Dividend Aristocrats Index ETF and S&P/TSX Canadian Dividend Aristocrats Index
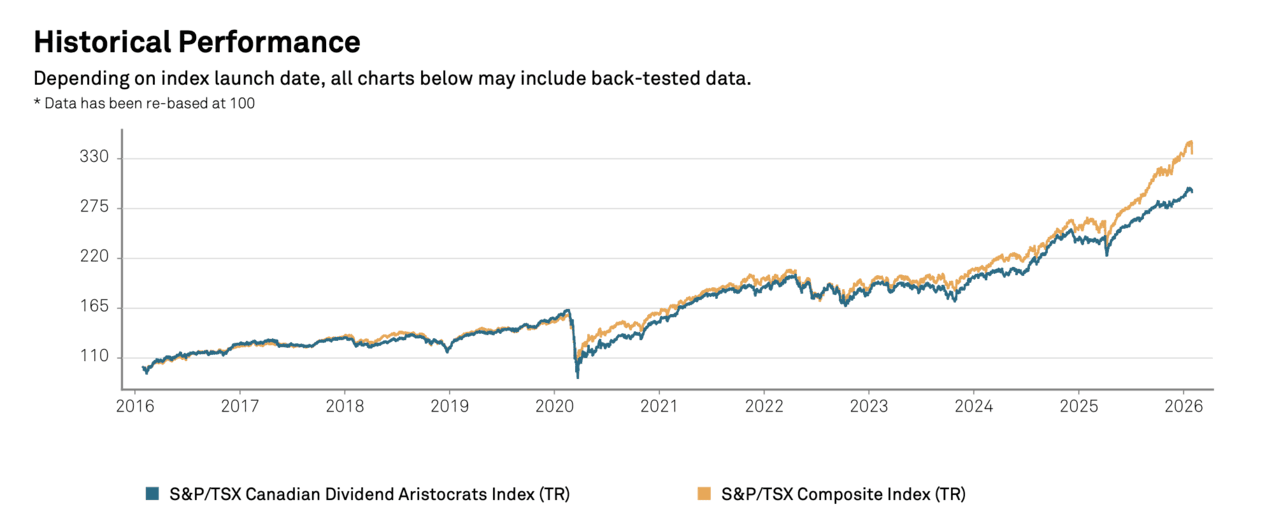
Historical Performance
As a group, the Canadian Dividend Aristocrats have exhibited slightly lower total annualized returns with more volatility than the benchmark index, the S&P/TSX Composite Index.
Over the past decade, the Canadian Dividend Aristocrats have had an annualized total return of 6.02% and a standard deviation of 13.76%, while the benchmark, the S&P/TSX Composite Index, had an annualized total return of 9.12% and a standard deviation of 13.07%.
Over the trailing five years, the Canadian Dividend Aristocrats have had an annualized total return of 7.57% and a standard deviation of 11.35%. The benchmark has had annualized total returns of 11.91% and a standard deviation of 12.56%.
The table below shows the calendar year performance from 2016 to 2025.
Changes to the Canadian Dividend Aristocrats in 2026
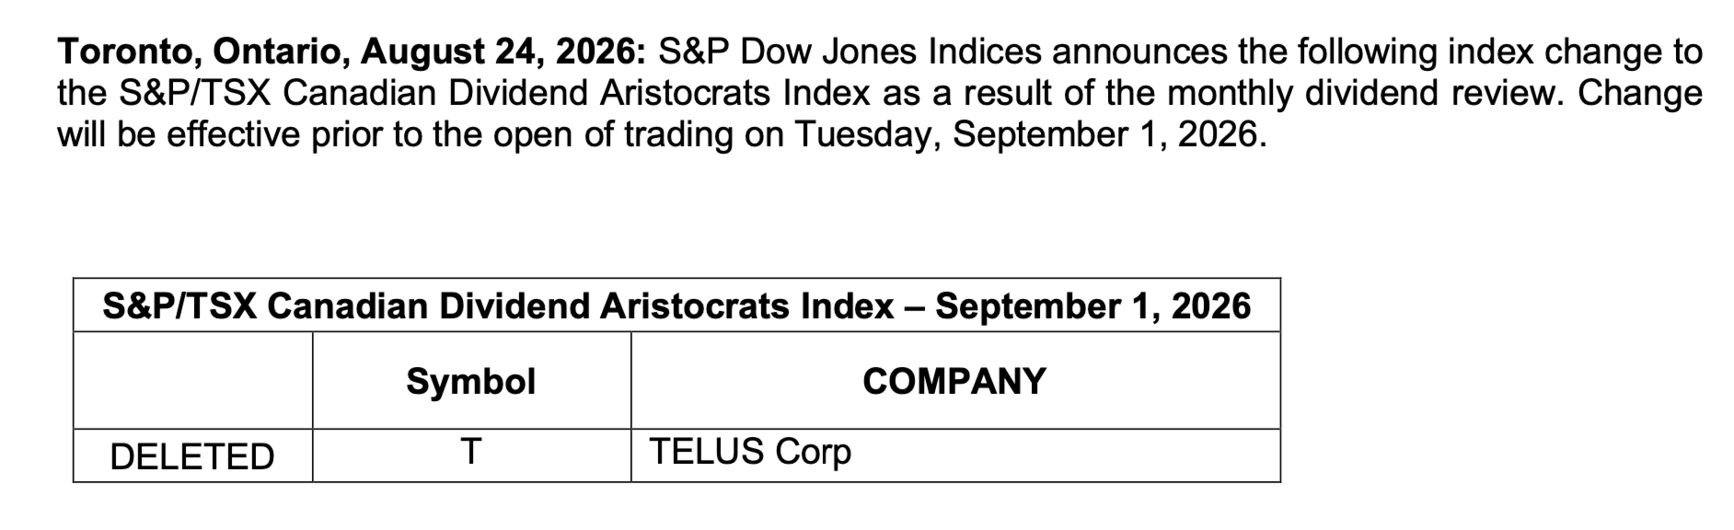
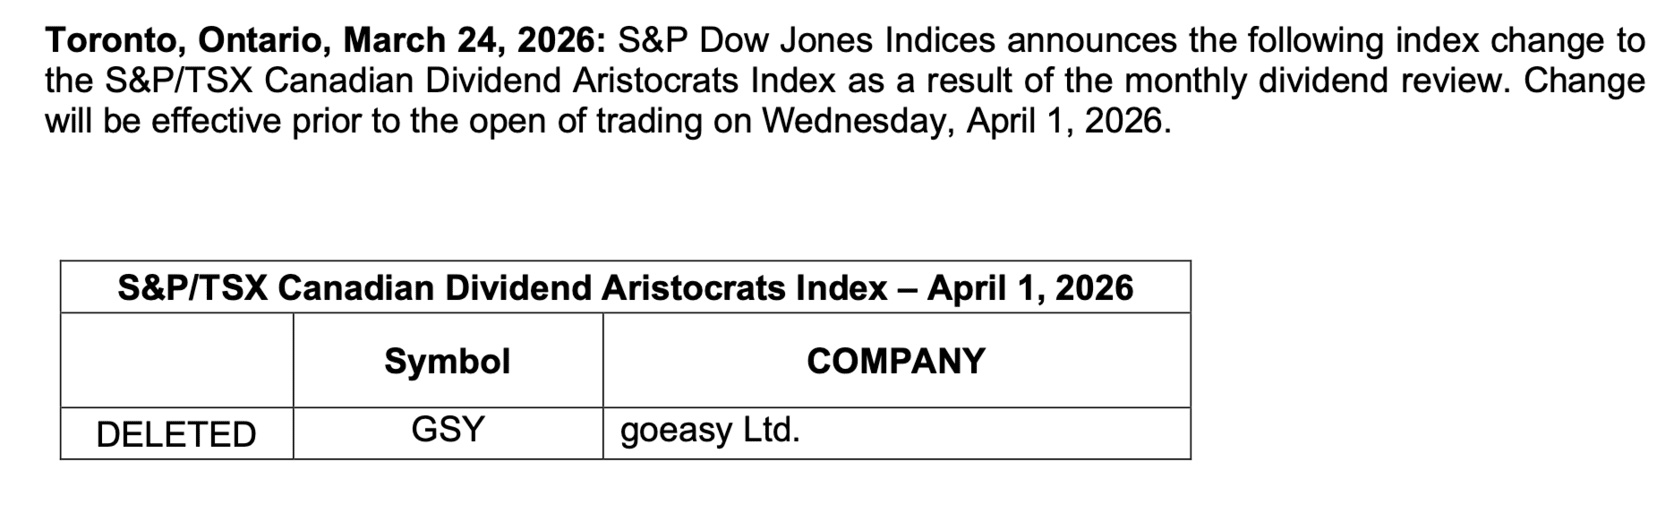
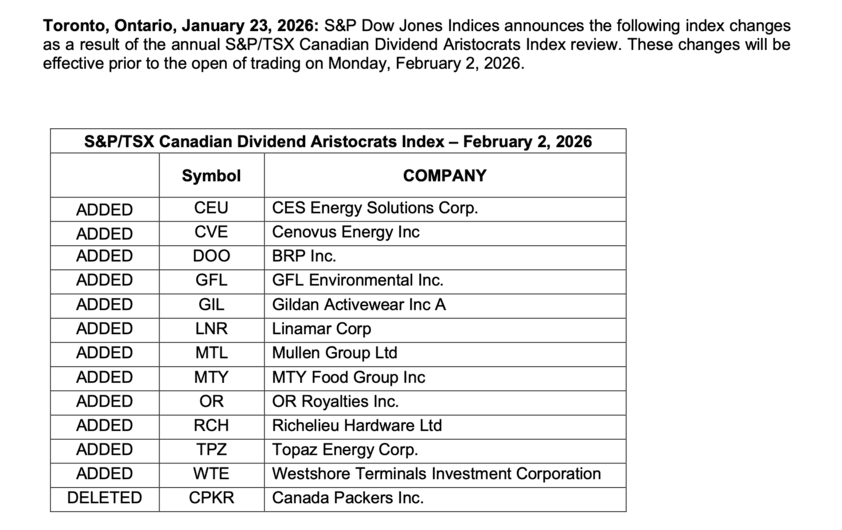
On January 23, 2026, the S&P Dow Jones Indices announced the list would be changed effective February 2, 2026. A total of 12 stocks were added, and one stock was deleted from the list of Canadian Dividend Aristocrats. There were 97 companies on the list after the changes were completed. Further changes delete more companies.
Other Dividend Stock Lists
For U.S. stocks, we have previously provided the following lists:
- List of Dividend Kings
- List of Dividend Aristocrats
- List of Dividend Champions
- List of Dividend Contenders
- List of Dividend Challengers
- Dogs of the Dow in 2026
For UK stocks, we have written about the following:
Other dividend stock lists
FAQs About the Canadian Dividend Aristocrats 2026
The Canadian Dividend Aristocrats 2026 is relatively select since it comprises only 93 companies. This number is from the 1,800 companies listed on the Toronto Stock Exchange.
Canadian Dividend Aristocrats Sector Breakdown
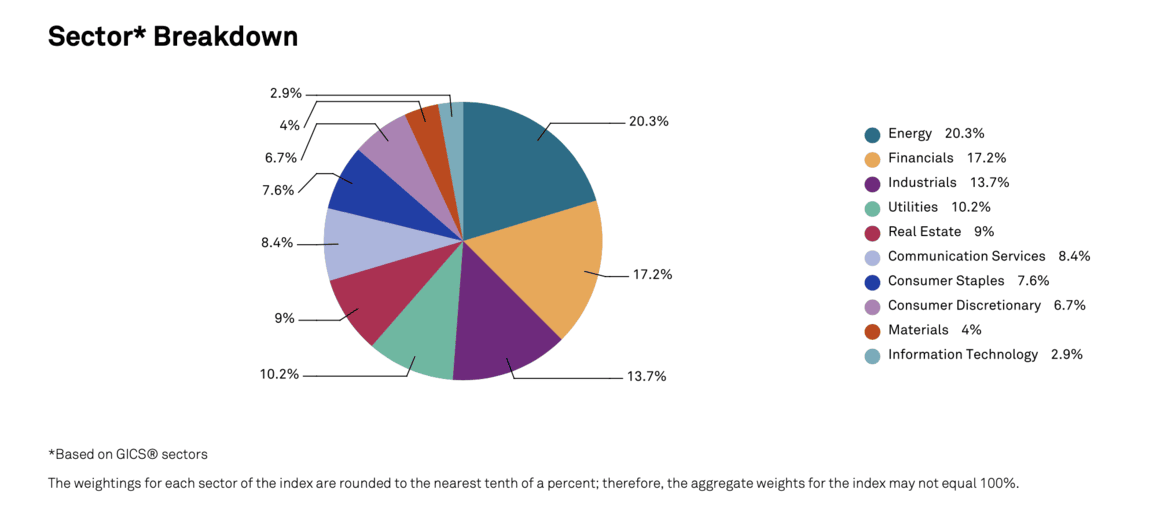
The chart below shows the sector breakdown for the Canadian Dividend Aristocrats 2026 is seen in the chart below.
The primary sector is Energy at about 21.6%. The Energy sector tends to have fluctuating revenue, earnings, and cash flow but can generate decent returns over time. So, its presence in the top three is unsurprising because the share price increases as revenue and profits climb. In addition, some companies in the sector keep the payout ratio relatively low to allow for future dividend increases
Stocks from the Financials sector have the second most significant representation on the list of Dividend Aristocrats at about 19.6%. Stocks in the Financial sector tend to have more volatile earnings and cash flows that depend on the stock market valuation and interest rates.
Industrials is the sector with the third highest representation, at approximately 16.98%. The Industrial sector tends to have cyclical revenue, earnings, and cash flow but can generate decent returns over time.
These three sectors comprise the majority of the Canadian Dividend Aristocrats at 51.2%.
Affiliate
Stock Rover is an award winning investment research platform.
- The site has 8,500+ stocks, 4,000 ETFs, and 40,000 mutual funds.
- Access to 650+ metrics, financial data, market news, stock and fund ratings, fair value, margin of safety, etc.
- Includes brokerage integration, portfolio tracking, rebalancing, watchlists, alerts, future income forecasts, etc.
- Plus export to spreadsheets, dividend calendar, 10+ years of data history, etc.
- Best Buy and Hold Screener by Investopedia
- Editor’s Choice by American Association of Individual Investors (AAII).
Click here to try Stock Rover for free (14-day free trial).
The sector ranking for the Canadian Dividend Aristocrats 2026 is unlike the US Dividend Aristocrats, which have Consumer Staples, Industrials, and Financial as the top three sectors.
It is also unlike the UK High Yield Dividend Aristocrats, which has Financials, Industrials, and Consumer Discretionary as the top three sectors.
Market Size of the Canadian Dividend Aristocrats 2026
The largest Canadian Dividend Aristocrat by market capitalization is the Royal Bank of Canada (TSE: RY), with a market capitalization of about CAD 370 billion. Conversely, the stock with the smallest market capitalization is Cogeco (TSE: CGO), with roughly CAD 465 million market capitalization. Combined, the 93 Canadian Dividend Aristocrats have a total market capitalization of over CAD 3.568 trillion.
Other Statistics
Canadian Utilities (TSE: CU) is the Canadian Dividend Aristocrat with the longest dividend increase streak at 54 years. Fortis Inc (TSE: FTS) has the second-longest streak of consecutive dividend increases at 51 years.
The top 10 members comprise about 24.8% of the Index and list. The greatest weighting is at 3.48%.
Here are my recommendations:
Affiliates
- Simply Investing Report & Analysis Platform or the Course can teach you how to invest in stocks. Try it free for 14 days.
- Free Dividend Kings Spreadsheet from Sure Dividend, complete with Buy/Hold/Sell recommendations, dividend histories, and much more. It is an excellent resource for DIY dividend growth investors and retirees.
- Stock Rover is the leading investment research platform with all the fundamental metrics, screens, and analysis tools you need. Try it free for 14 days.
Receive a free e-book, “Become a Better Investor: 5 Fundamental Metrics to Know!” Join thousands of other readers !
*This post contains affiliate links meaning that I earn a commission for any purchases that you make at the Affiliates website through these links. This will not incur additional costs for you. Please read my disclosure for more information.
Prakash Kolli is the founder of the Dividend Power site. He is a self-taught investor, analyst, and writer on dividend growth stocks and financial independence. His writings can be found on Seeking Alpha, InvestorPlace, Business Insider, Nasdaq, TalkMarkets, ValueWalk, The Money Show, Forbes, Yahoo Finance, and leading financial sites. In addition, he is part of the Portfolio Insight and Sure Dividend teams. He was recently in the top 1.0% and 100 (73 out of over 13,450) financial bloggers, as tracked by TipRanks (an independent analyst tracking site) for his articles on Seeking Alpha.